Eyetracking Walkthrough
Welcome to the first Labvanced walkthrough featuring the eyetracking setup guide to your next project. Overall, this information content will be split into four parts, starting with the overall system setting check before creating a study and finally to the data view explanation. Beyond this step-by-step document, the video tutorialcontent is also available in the Labvanced video tutorial, along with all the other guides to help you along with your online experiment creation. Without further a due, let’s dive into the eyetracking study creation.
Part I: System Setting
First, it is essential to select the Labvanced V2 for the eyetracking measurement (Figure 1 below) using our deep learning algorithm. Afterward, there are three options to choose the length of the calibration. The standard default option is 5 minutes, but the experimenter can also choose <1 min, 3 mins, or 8 mins calibration. The longer duration will require more head position calibration with increased fixation points providing the most optimal measurement precision. However, considering the type of study and participants that will undergo the experiment, the shorter duration could also be optimal to mitigate the time and fatigue of the participants, especially if you have infants in your study.
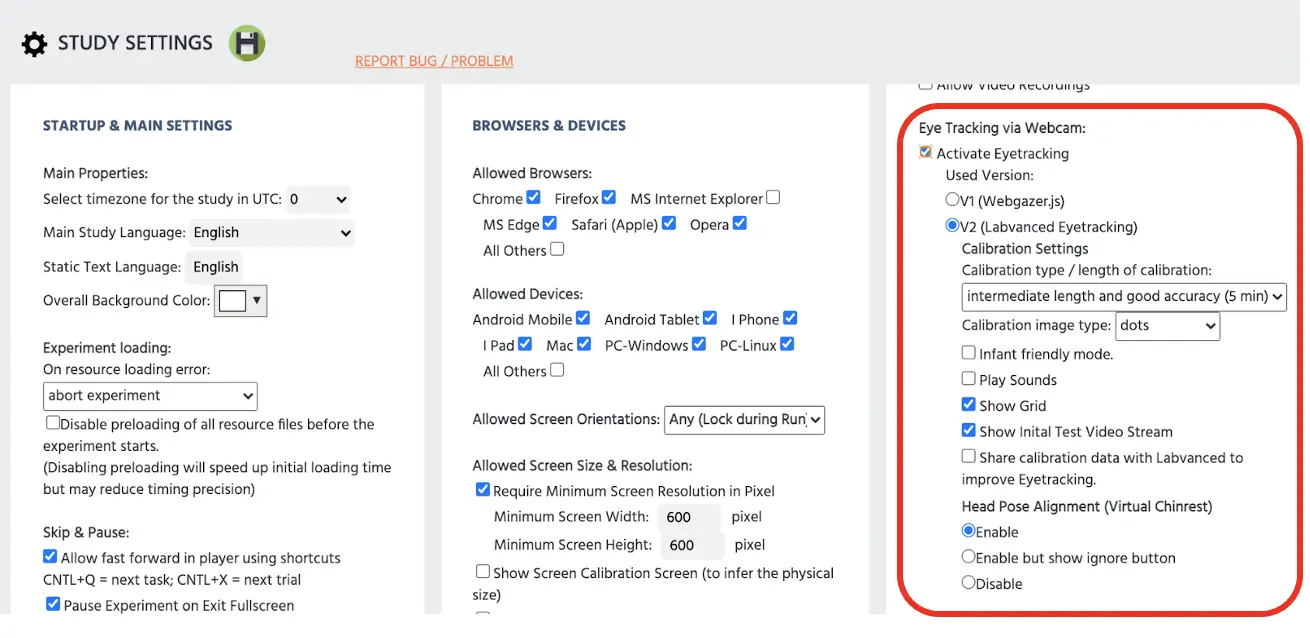 Figure 1. Initial screen under the Study Setting page. The experimenter must select the Activate Eyetracking option to adjust the following selections within the displayed red box to use eyetracking.
Speaking of infants, there are additional options to optimize the gaze readings from the young participants by selecting animal image options for the Calibration image types. The animal calibration display could pair with the Infant-friendly mode selection (see Figure 1). Selecting this option will automatically adjust shorter calibration and accompanying sound (can also be off) to aid the infant’s attention and decrease boredom. In the same section, the Show Grid option could help the participant anticipate the next point of the calibration to help with the optimal calibration process.
Right below the Show Grid option, there is also an option to check Show Initial Test Video Streams (see Figure1). The participants would see themselves in the video stream with the face mesh overlay before the main calibration by selecting this. The importance of the face mesh is further explained in the later section of this walkthrough, but having the test video is highly recommended to see if the participant’s computer could handle the webcam eyetracking measurement. As a recommendation, it is ideal to use the computer with a separate GPU for optimal eyetracking. Suppose the hardware is not optimal on the participant’s end. In that case, the initial test video will remain static and not proceed forward, serving as the initial check whether the participant should continue the study. In this case of less optimal computer hardware, they can abort the study and aid the experimenter with less data noise in the comprehensive data.
Furthermore, the experimenter could also select the Head Pose Alignment option in the same settings display, which serves as the virtual chin rest. This added measurement aims to mimic the function of the physical chin rest used in the laboratory setting, where the chin is positioned on the head mount to maintain the head stillness. By checking the head position alignment option, Labvance will measure various head orientations during the calibration stage. More information will be available in the later paragraph of its specific process. Having the head position factored into the eye measurement will improve the quality of the data by mitigating the noise confounded by the head misalignment. Suppose the participants significantly move their head out of the center pose. In that case, the program will interrupt the study and prompt the participant to realign and refocus to the virtual chin rest, aiding the participant’s focus and maintain a similar head position through the study. More importantly, controlling for the head position will also assist with the overall quality of your data. Although enabling this option is highly recommended, there is also an option to also ignore during the experimental run. Depending on the study participants, continual head position maintenance could be difficult involving the infants, so this option would allow participants (or parents) to turn off and skip this process throughout the experimental run.
Last but not least, there is also an option to Share calibration data with Labvanced. Primarily this is to improve the algorithm of the Labvanced eyetracking for a better user interface, but this is entirely optional based on the researcher’s discretion. In the next part, we will dive into the canvas page to go through a few more preparations before the experiment creation and data recording.
Part II: Task Editor
Beyond preparing for the eyetracking study with the Study Settings page, there are additional preliminary preparations to note on the canvas page and essential information of creating new variables to store the gaze data.
Physical signals
By clicking on the Physical Signals button on the top left-hand of the canvas screen, the dialogue will open with different options of eyetracking (see Figure 2). Firstly, you would want to enable eyetracking in the task editing to allow the gaze measurement to occur during your study. Of course, this could be disabled if you only investigate the behavioral measure (e.g., reaction time and accuracy).
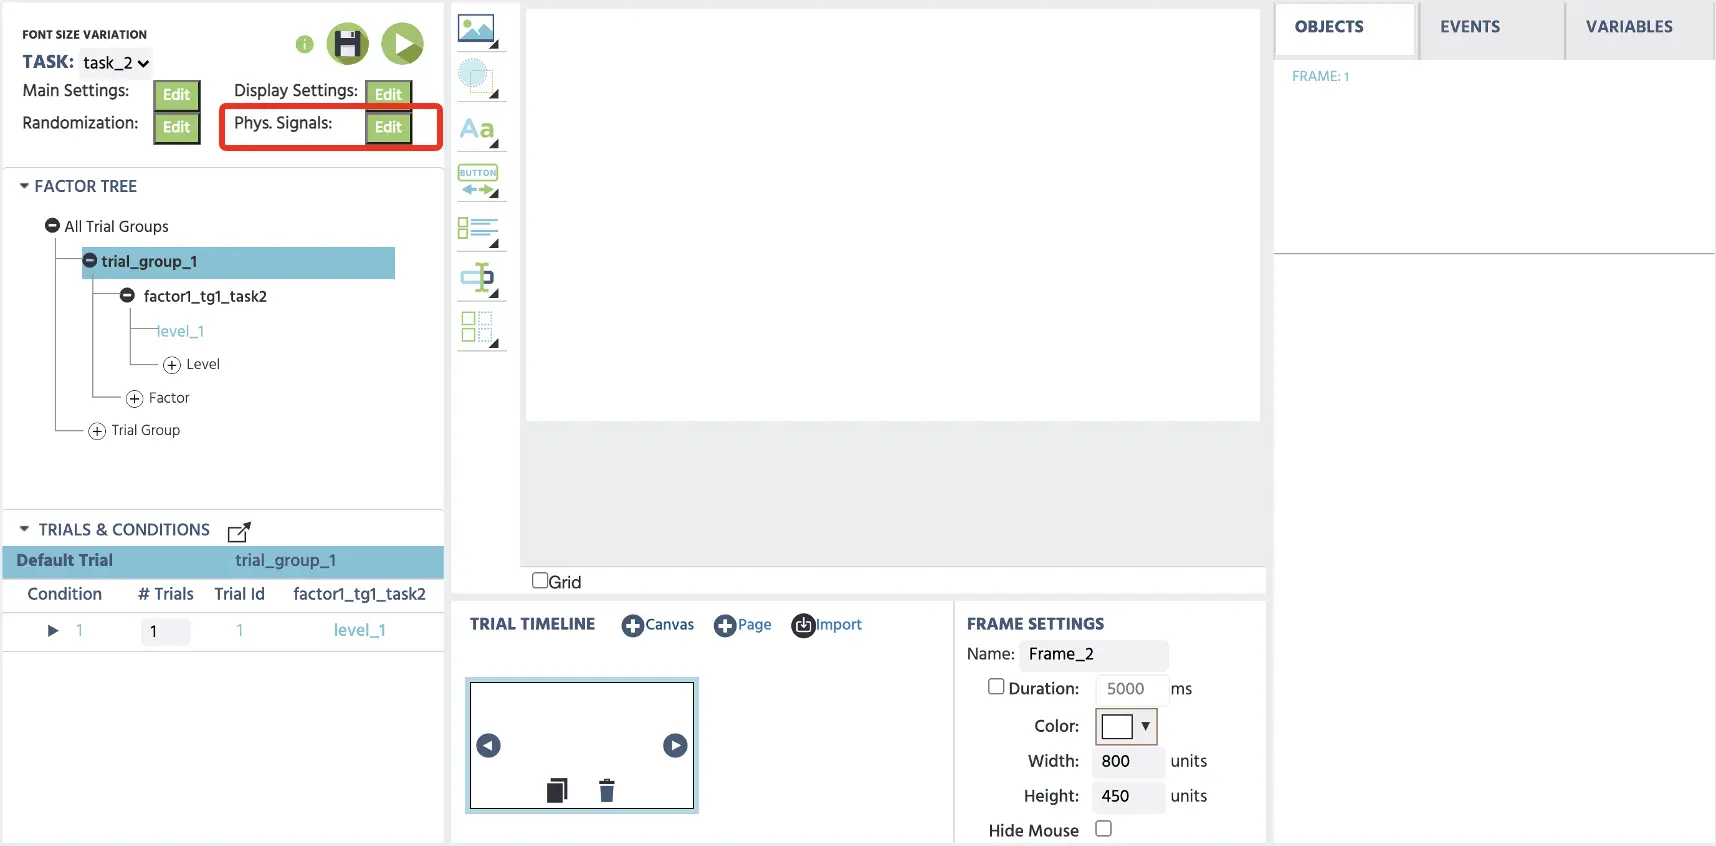 Figure 2. Canvas screen within a task. The red box indicates the Physical Signals option to enable eyetracking in this task and determine the number of fixation points for the intertrial validation.
Importantly, the main calibration will always occur before the first eyetracking task. For example, if you have four tasks in a block sequence for eye-track measurement, the Labvanced will prompt the calibration before the 1st of the four tasks. This would allow the experimenter to plan accordingly when the calibration occurs within the study construction.
The other option in the same option display is the Number of Fixations to show during the validation stage between each trial (see Figure 3). By setting the value to zero, this would skip the validation process. However, increasing the fixation numbers would present more fixation points to validate the eyetracking measurement during the intertrial periods. This is important for the eyetracking algorithm to mitigate systematic error and to calculate drift correction. For instance, if some participants are more orientated towards either left or right, the validation process will counter this drift for error improvement. The other useful option is to directly apply the offset by clicking on the User per trial drift correction. The last option to note is the Number of fixations to use for drift correction for the number of points you want to calculate for drift correction. During the correction, past trials are factored into the calculation to account for the participant’s error from the main calibration.
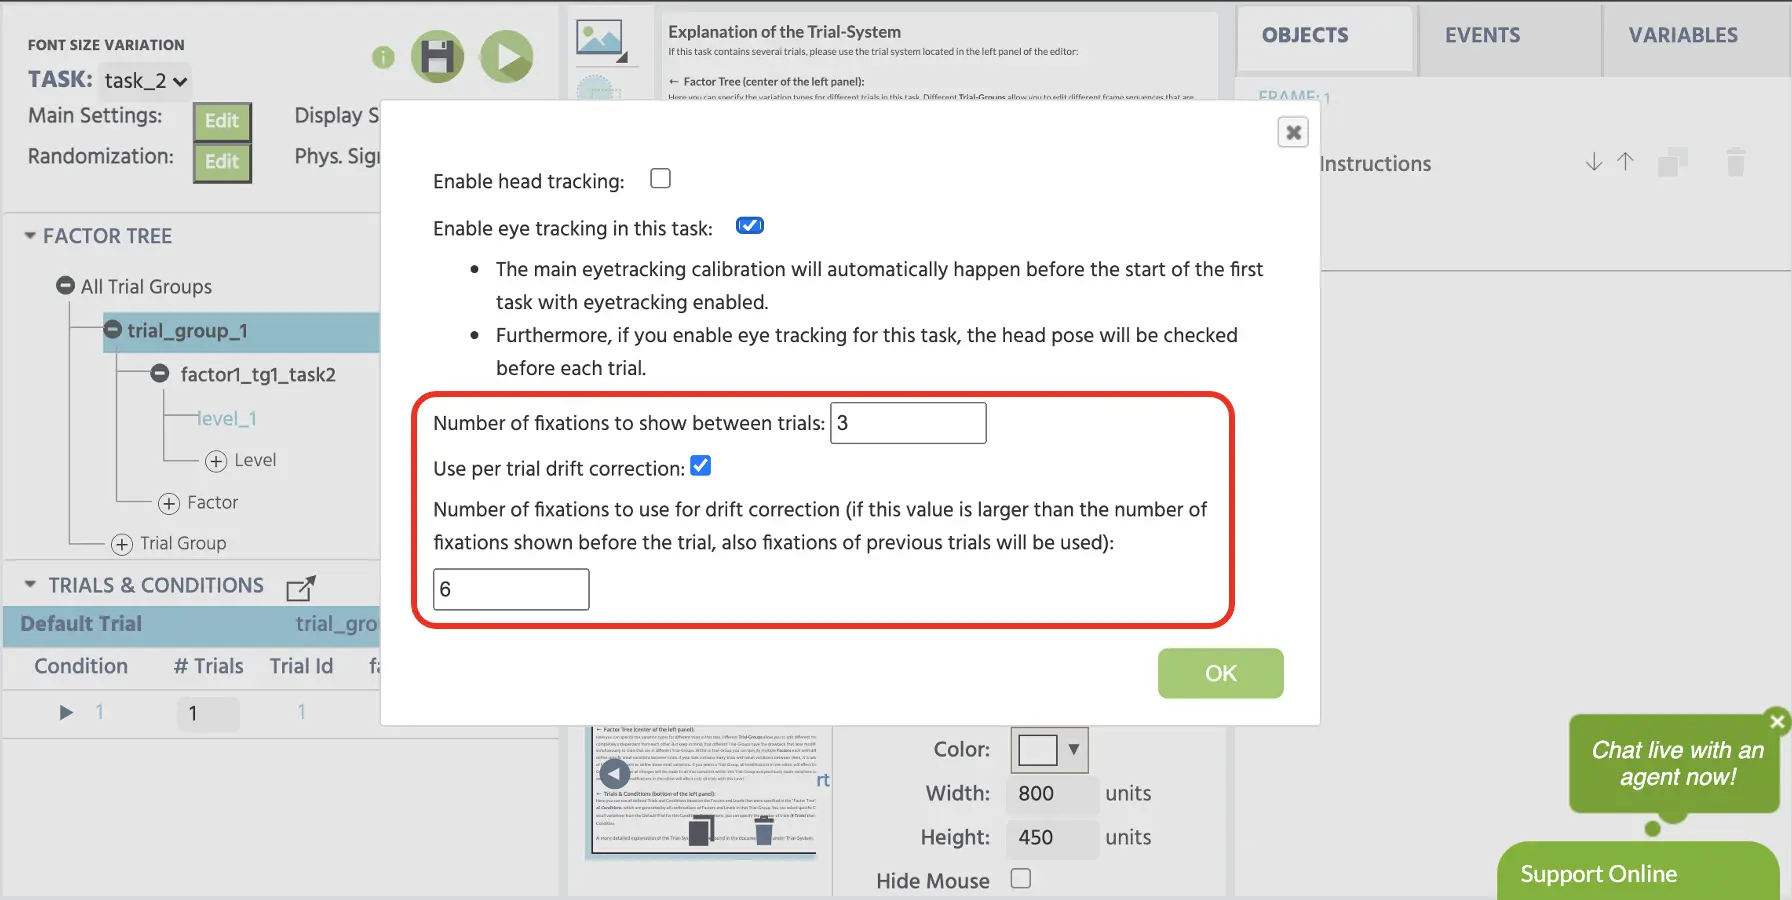 Figure 3. Display of Physical Signals. The red box indicates the options displayed within the Physical Signals with standard fixations value of 3 and drift correction value of 6.
Display setting
Another vital thing to note for task editing is the display setting options. For the general Labvanced task, the display setting is set at Zoom/Adaptive mode (see Figure 4 below) that will scale the display frame such that it will fit on every screen for the participant’s display. But for eyetracking, you may consider the fixed option in either Visual Degree or Millimeter option. This can be quite useful, as this will allow tracking participant’s eye movement in visual degrees rather than relying on screen frame units that will also require additional calculation to quantify the spatial distance. The same benefit could also be applied to the millimeter measurement. Critically, changing the display setting option will change the study setting display, which we will track back to that display.
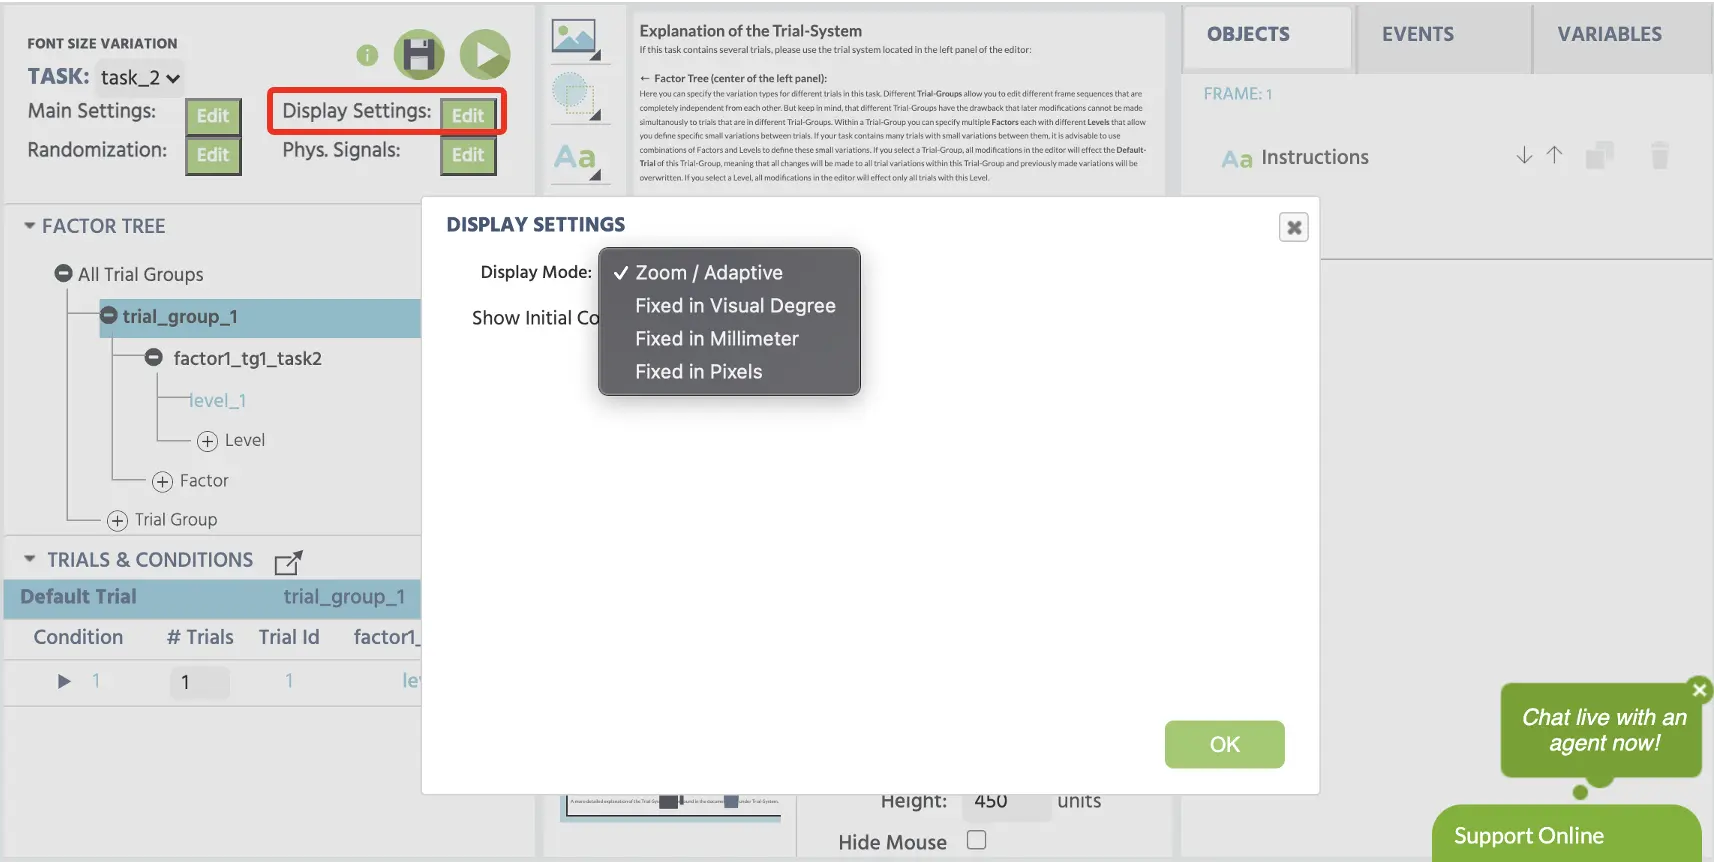 Figure 4. Display of Display Settings set at default Zoom/Adaptive mode
Back to Study Setting, the Display Setting change will allow additional options of Screen size & Resolution to define the minimum screen size either in visual degrees or millimeters (see Figure 5 below). However, the Show Screen Calibration option will always be selected (displayed in gray color), and this provides an on-screen template that will prompt the participant to hold a credit card size item to the screen and adjust the template to fit the physical card size. Such physical measurement calibration allows the Labvanced algorithm to infer the display size to accommodate different monitor setting variations.
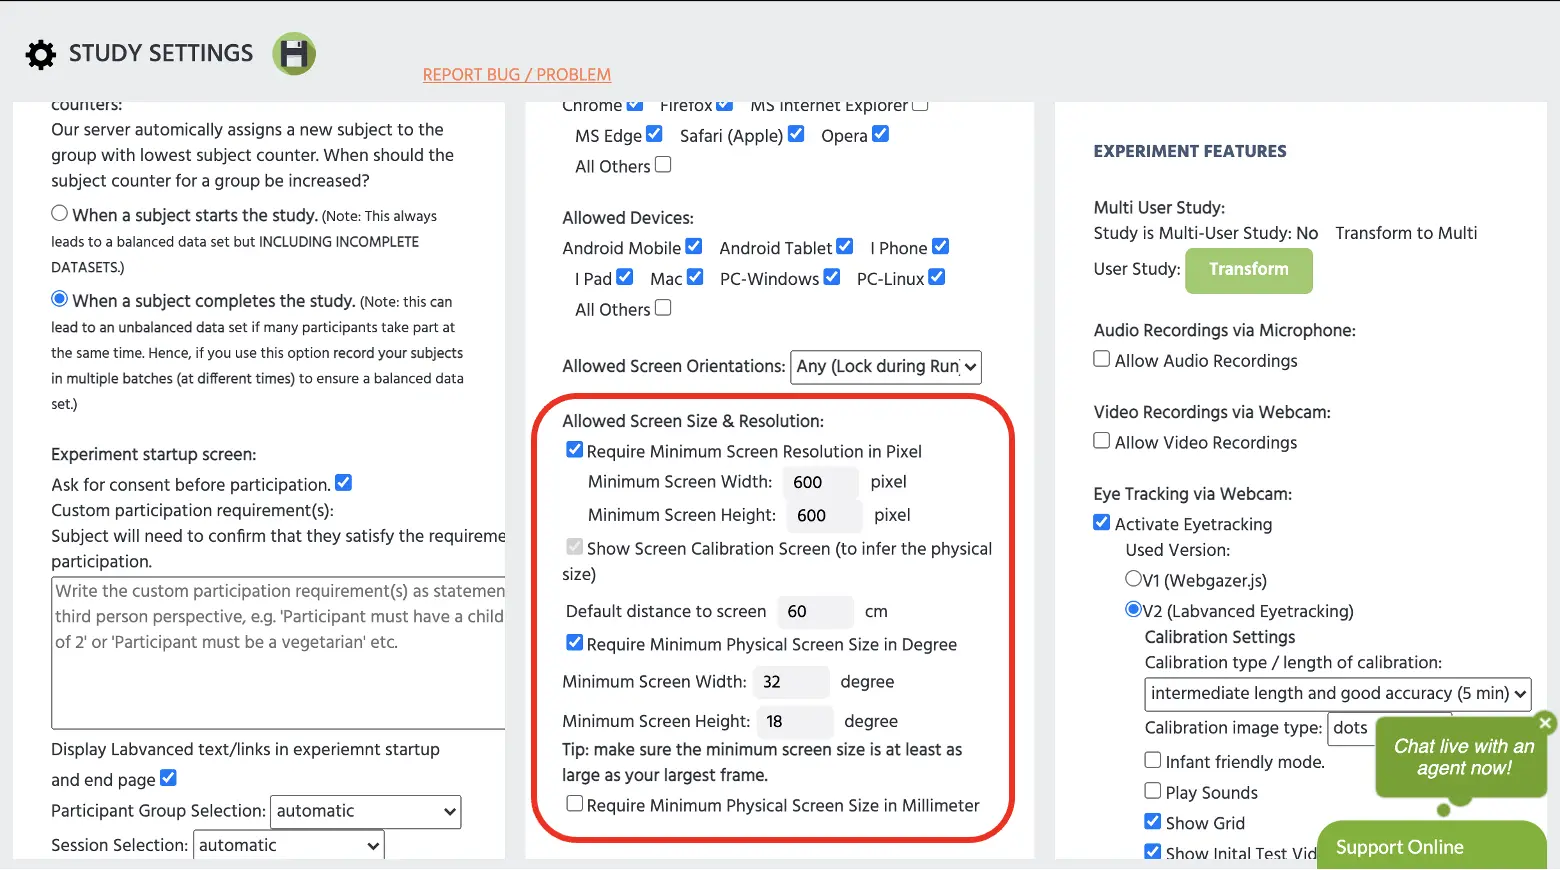 Figure 5. Display of Study Setting page. The red box indicates the options for set minimum screen size in visual degrees, millimeters, or pixels. Note the Show Screen Calibration is always selected in gray.
Events & Variable setup for Eyetracking data
To record the eyetracking data, this could be done by creating a new event. If an experimenter wants to measure the eyetracking by a particular image, this could be set up by the Eyetracking trigger under Physiological Signals (see Figure 6 below). This means every time the webcam processes an image or a target; this would trigger the sequence of the event to a particular action. For example, suppose you desire to have the specific element (e.g., fixation cross) as the trigger. In that case, there is a check option: Only trigger when looking at specific elements, and set the target to a particular item (e.g., fixation cross or image). By not checking this option, eyetracking will record everything that is followed by the recording action.
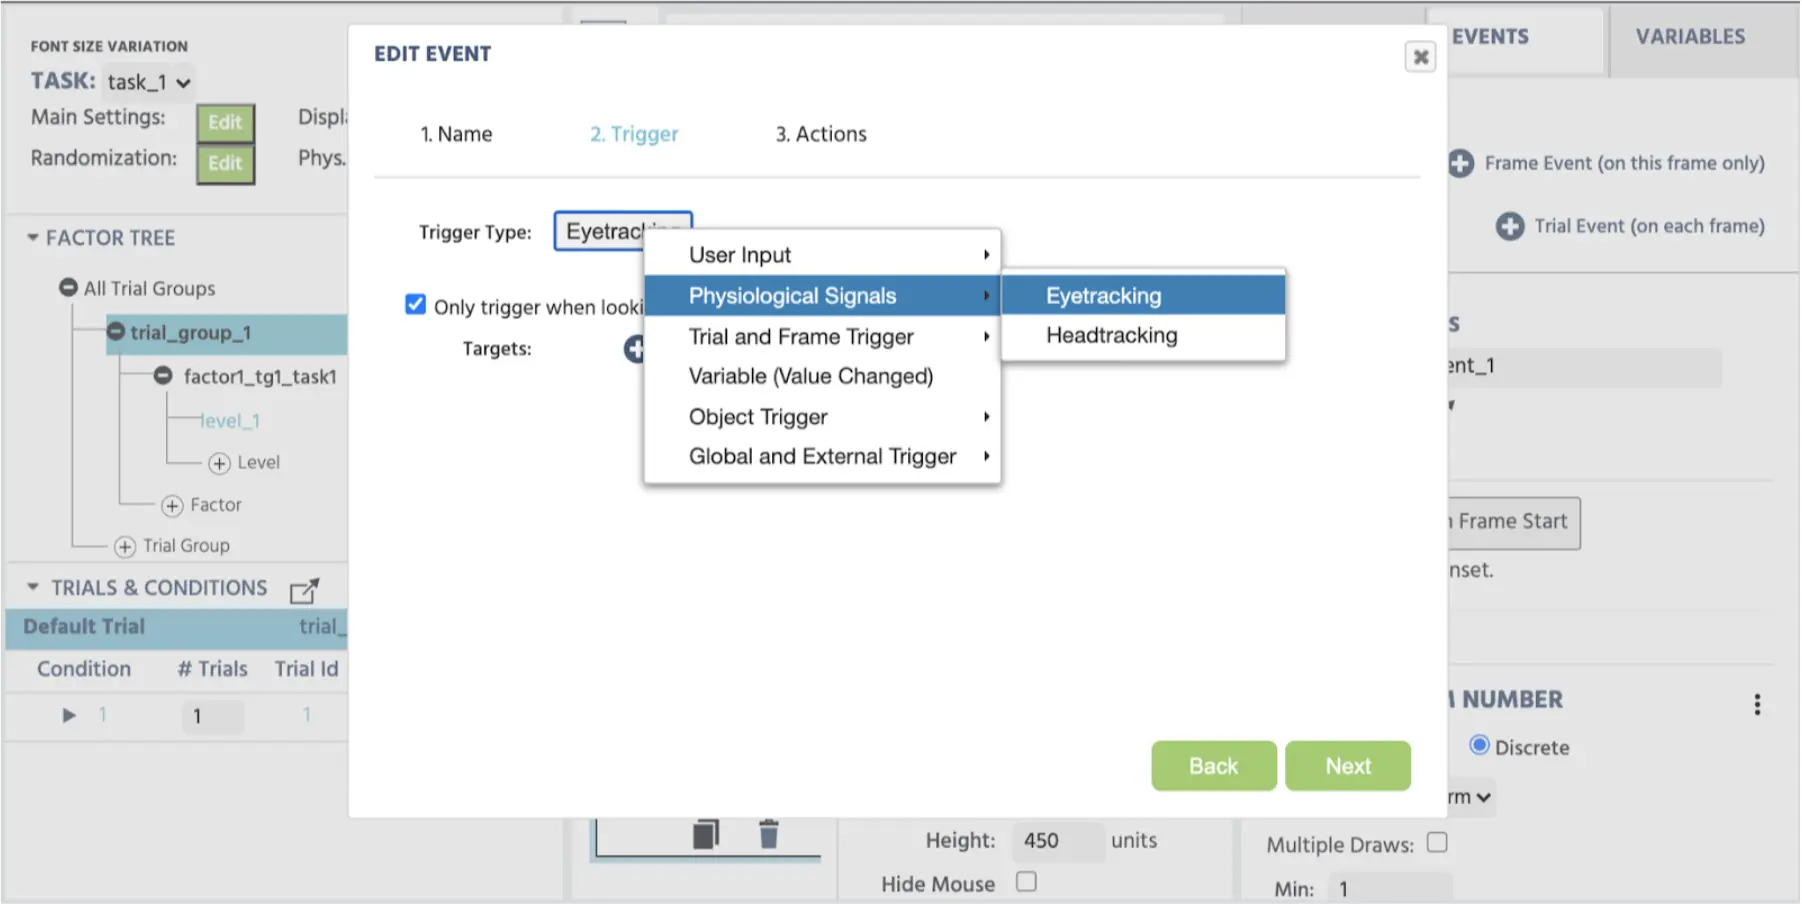 Figure 6. Display of Event setup to record the eyetracking. The checkbox under the Trigger Type indicates the trigger option when looking at the specific elements, such as fixation cross or image.
To set the recording variable, use the typical Set/Record variable action, and on the right side, follow the Use Trigger (Eyetracking) to proceed to the data option. Ideally, it is recommended to select the [X, Y, T, C] array (see Figure 7), as this will provide all the crucial gaze measurements of:
- X = X frame coordinate
- Y = Y frame coordinate
- T = UNIX timestamp
- C = Confidence of eye detection for blink/error detection
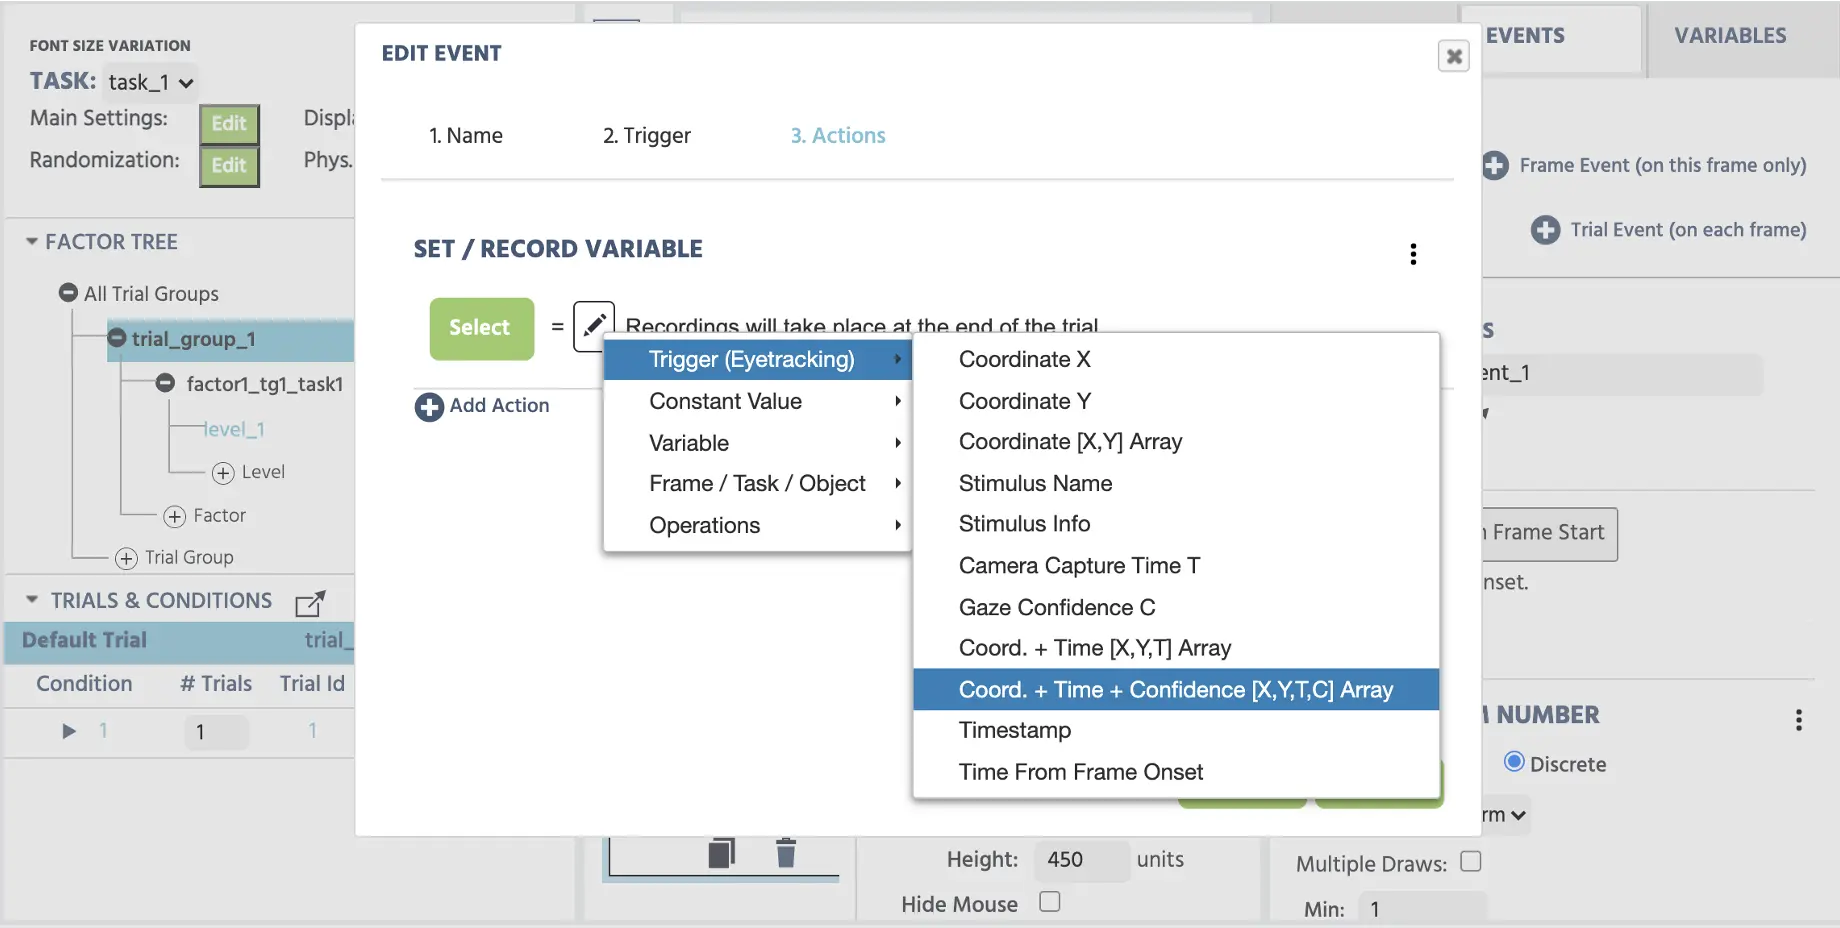 Figure 7. Display of Event setup to record the eyetracking measurements.
On the left side of the Set/Record variable action, a variable (ideally a new variable) will store the eyetracking data. When creating a new variable, it is crucial to set the variable Format to Data Frame Array - as the [X, Y, T, C] is an array data, and set the Data type to Numeric (see Figure 8 below). Lastly, it is important to change the Record type to All changes/Timeseries. We will discuss more info on the time series in a later section, but in general, this option allows recording multiple values per trial, rather than only the final value at the trial end. It would be ideal for examining multiple gazes, time, and confidence scores in the recording within a trial so that the time series will provide more nuance to the overall eyetracking measurement.
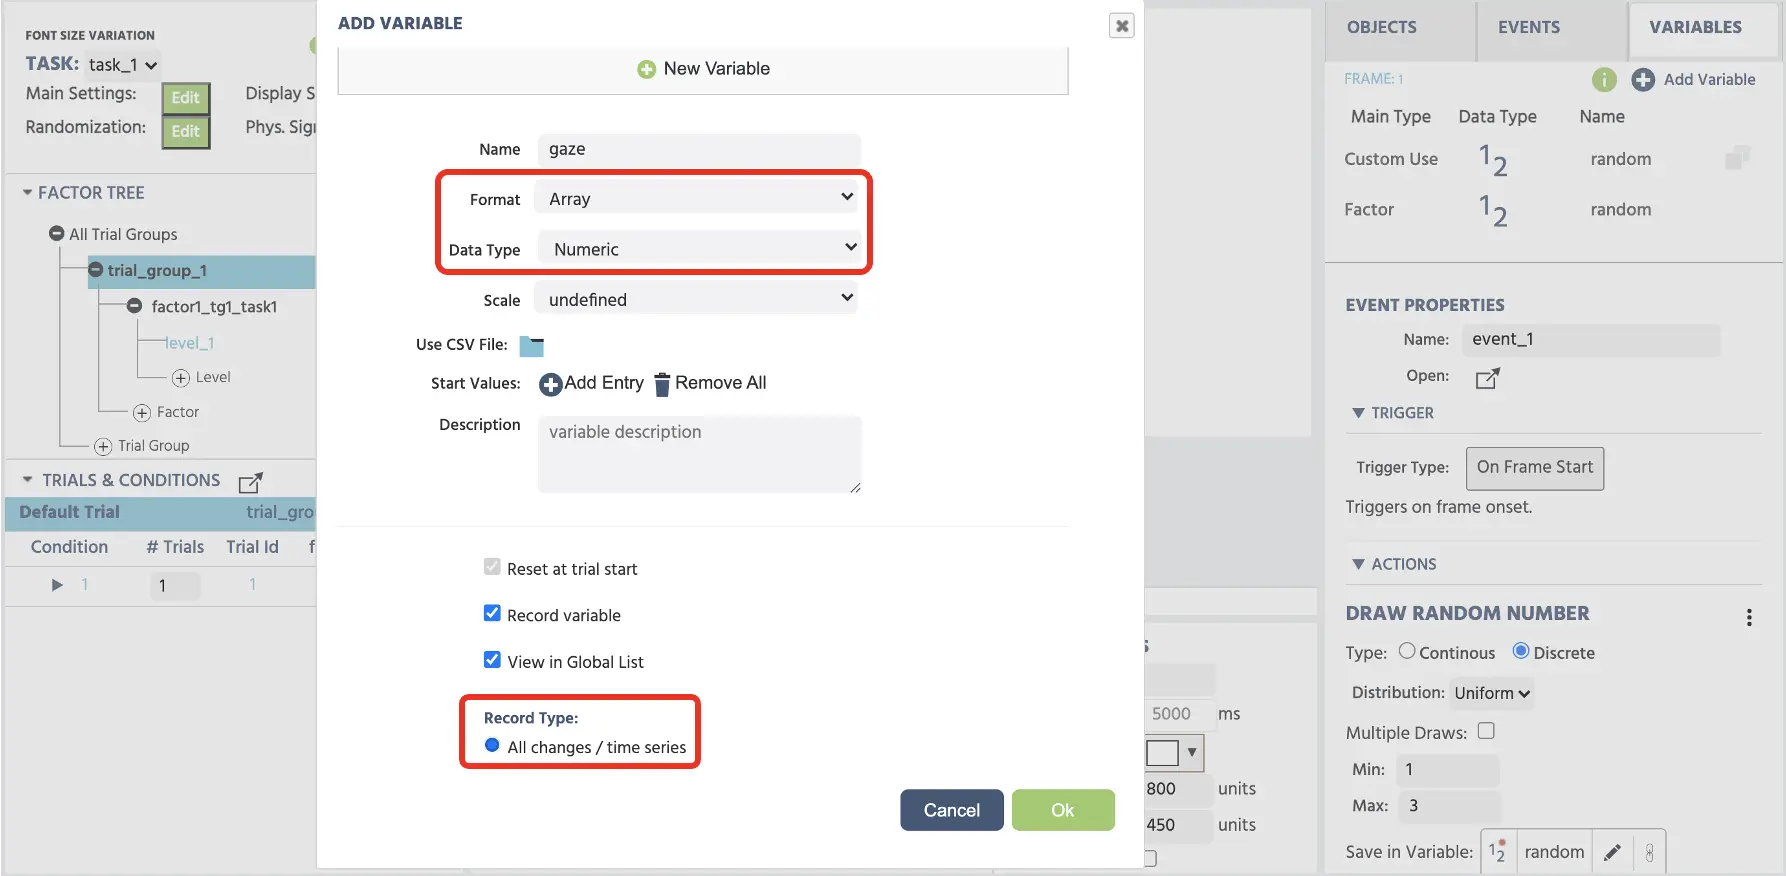 Figure 8. Display of New Variable setup to store the eyetracking measurements. The top red box indicates the Format set to Array and the Data Type to Numeric. Beyond these two important settings, the second red box below also depicts the critical Timeseries option that would be required to view the multiple gaze measurements in a trial.
Part III: Study creation
Let’s say a researcher want to create an object discrimination task (Figure 9A) using a mouse click with n-number of trials using the eyetracking measurement. This could be set up using the mouse trigger and Set/Record action (see Figure 9A & 9B). The jump action could follow this to move to the next trial.
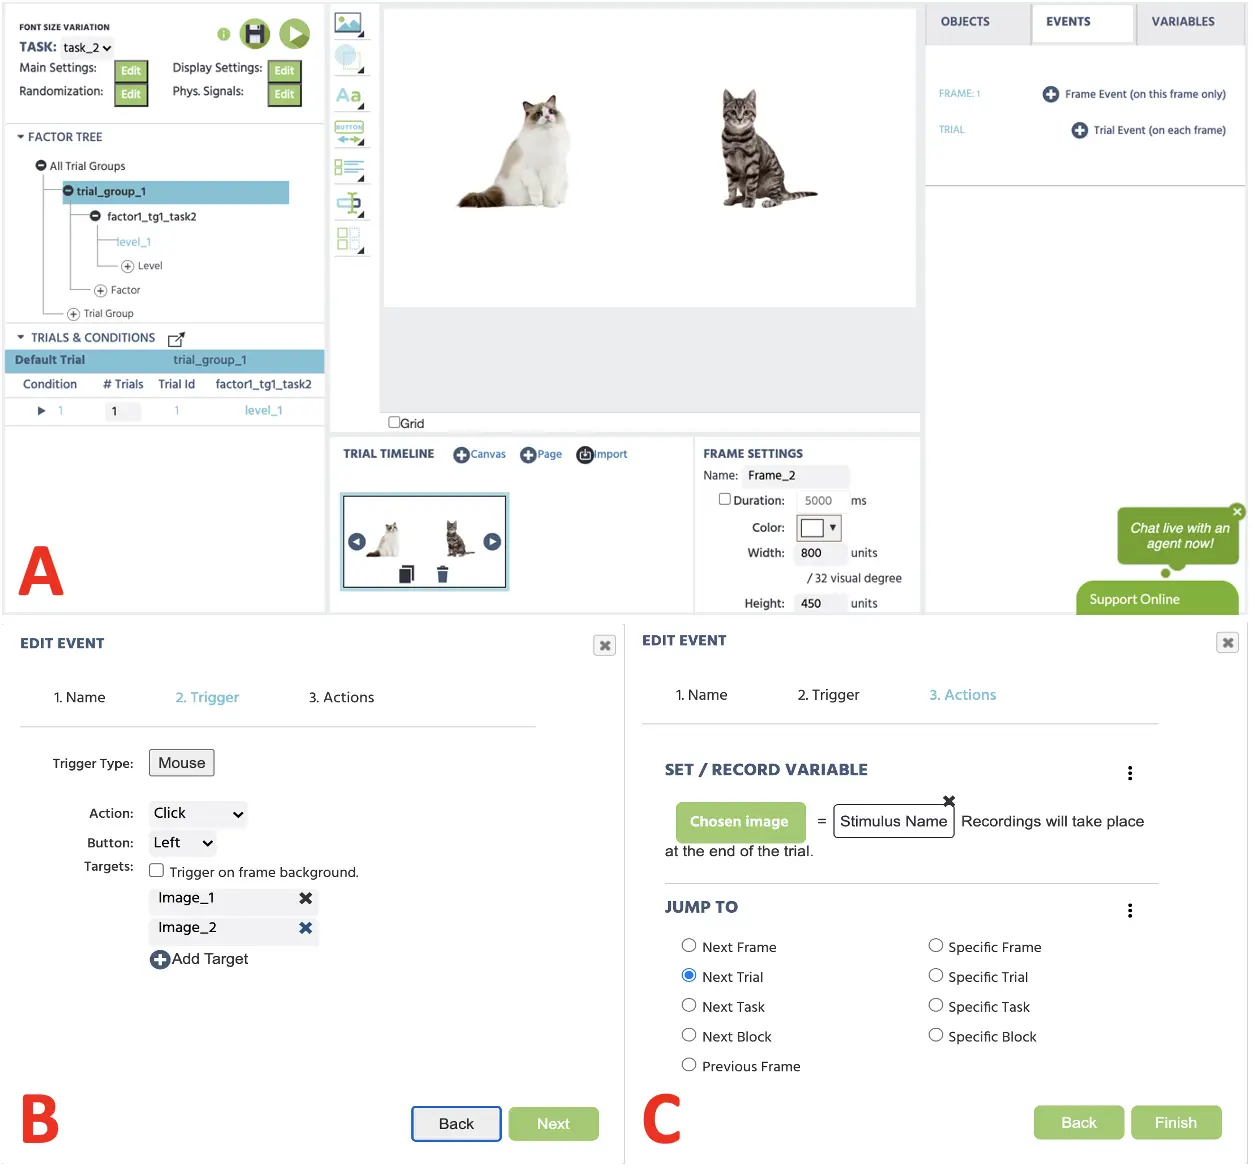 Figure 9. Display of canvas with object discrimination setup with two image displays (A) with events setup using the mouse trigger (B) and the action set up (C) to record the selected image with subsequent jump action.
Beyond recording the mouse click, the eyetracking setup requires two more variable recordings that are crucial for the gaze measurement. These are, Error calibration and Error trial that needs to be triggered by the Frame Start and proceed Set/Record action to store new variables (see Figure 10 below). The Error calibration provides a single numeric value that provides the precision of the main calibration, and the Error Trial pertains to the precision during each individual trial. Later discussion at the dataview section will provide more information on these two readings.
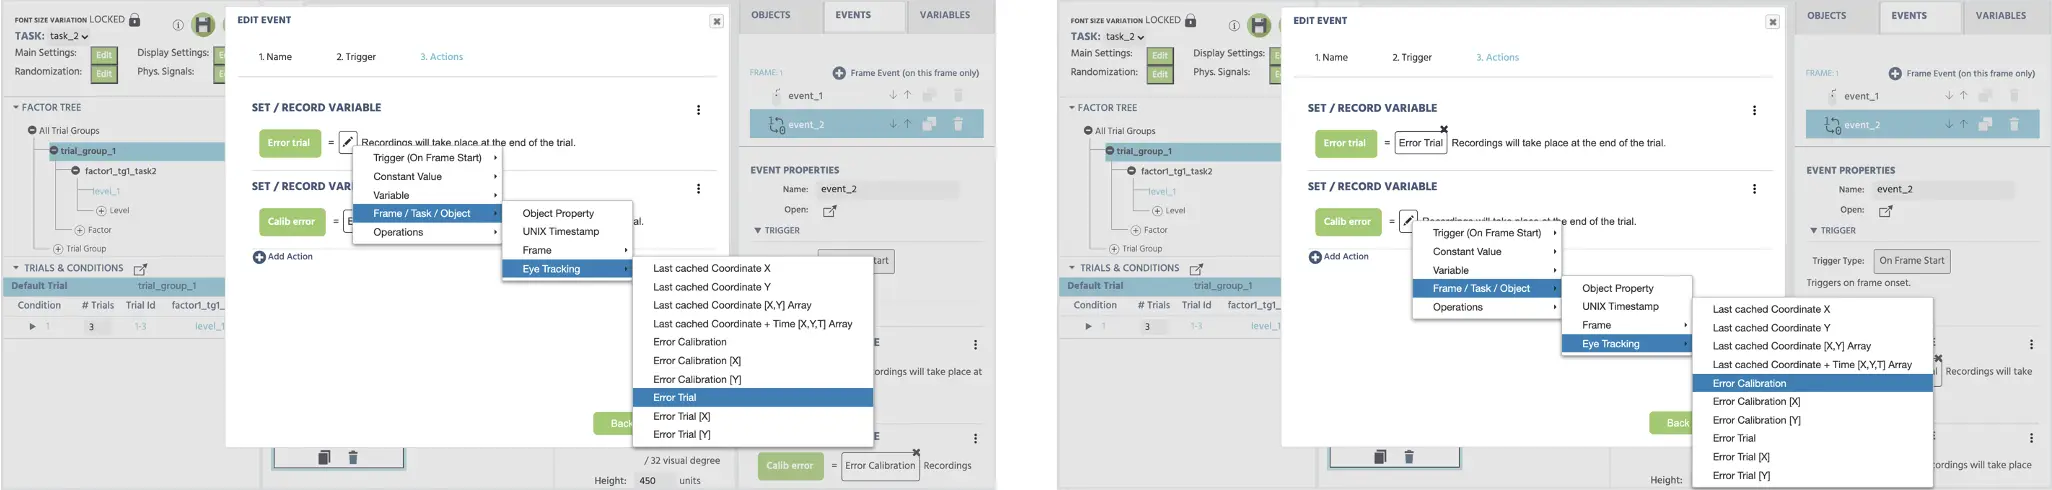 Figure 10. Display of events creation for Error calibration & Error trial.
It is important to note that the background should be the same during the main calibration task during an eyetracking study. For example, in the Figure below, the display shows a white background with two picture stimuli. This background should be the same in the Study Setting page (see Figure 11) under Overall background color, which is the same background Labvanced will use for the main calibration. If colors are different between the main calibration and study phase, this could result in possible errors in the data, leading to an experimental confound.
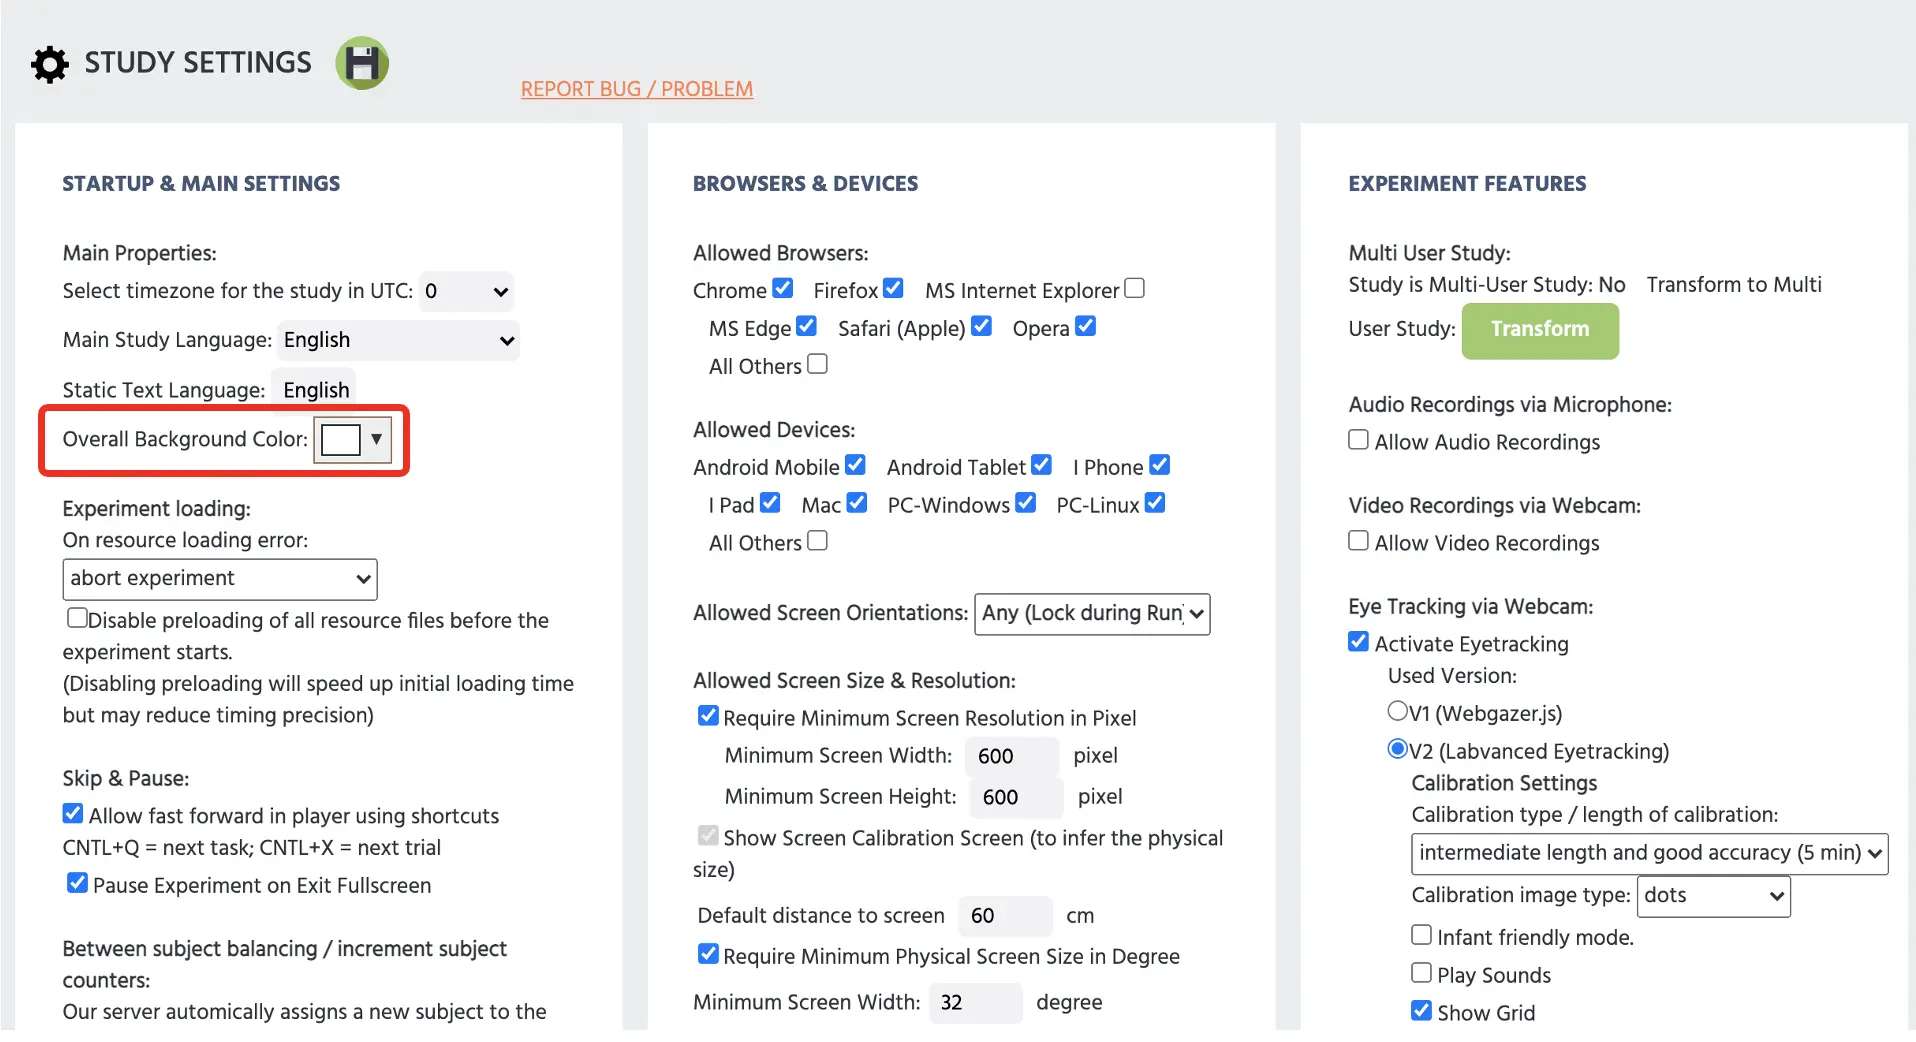 Figure 11. Display of study settings page. The red box indicate the background color that should be same with the canvas page during the main study creation.
During the recording phase of the study, there will be the initial short video check (see Figure 12). As previously mentioned, this is where the participants will see his/herself in the face overlay mesh in blue before the study initiation. This is also when the participant will evaluate whether the video works without any error; otherwise, this would indicate the inadequate hardware to process the video quickly. If this is the case, the researcher instructs participants to abort the study, saving unnecessary time on their end and decreasing the attrition with the comprehensive data.
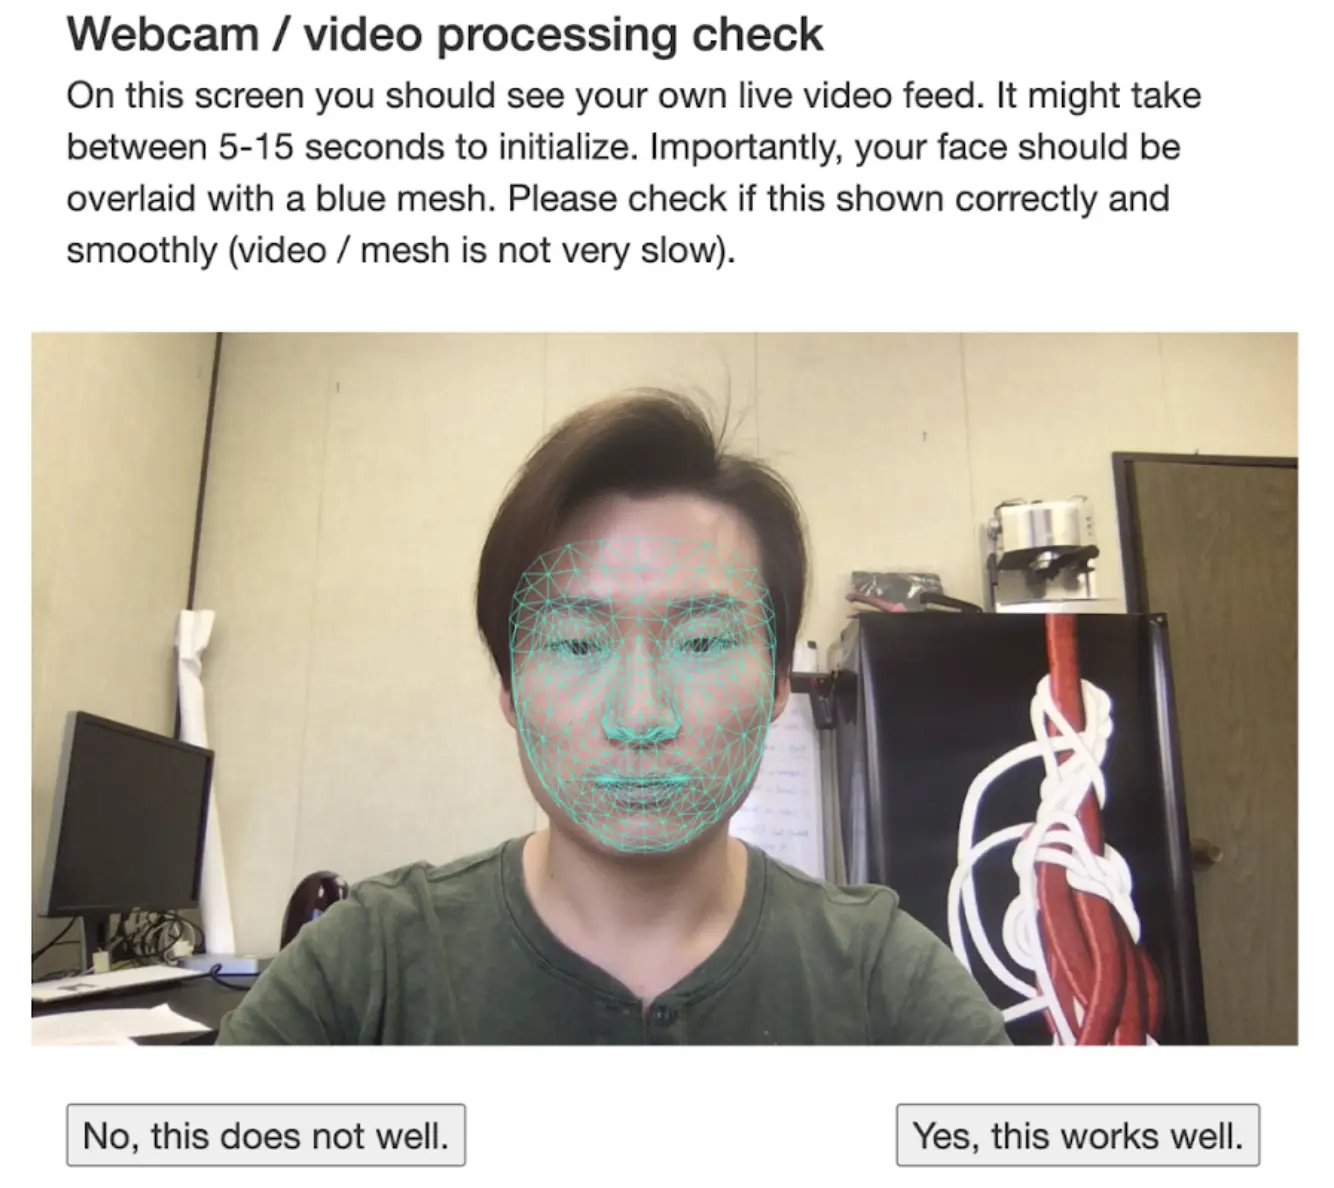 Figure 12. Display of preliminary webcam/video processing check with blue mesh overlay
Should the participant proceed forward after the video checking phase, the calibration instruction will display with a default screen instruction. The experimenter could change the instruction; otherwise, the general advice will prompt the participant to:
- Be in a quiet room
- Have enough time
- Not wear glasses - the reflective property of some lenses could affect the reading
- Maintain the center position of the screen
Following this, the participant is required to position their head to various orientations, matching the blue overlay mesh to the green ‘mask’ serving as the virtual chinrest (see Figure 13). This will allow the algorithm to train individually for each participant with different head orientations to predict the eye’s position during the subtle head movements during the study phase. As mentioned previously of the important feature of the virtual chin rest, the different head orientations that the participant must follow will serve the same functions as the physical chinrest to mitigate the head discrepancy. Suppose there is a significant discrepancy between the blue overlay mesh and the green mask. In that case, the program will interrupt to instruct participants to reorient their head position after the respective trial. This interruption will occur during the main calibration stage and throughout the study; such significant head misalignment is detected by webcam tracking. As a quick reminder, the duration of the main calibration will vary from <1min to 8 mins, as the latter requires more head position orientation with additional fixation calibration to provide the best accurate measurement. Lastly, throughout the study trials, the validation session with varying numbers of fixation points will be present to minimize the error variation and mediate accurate readings for the confidence scores.
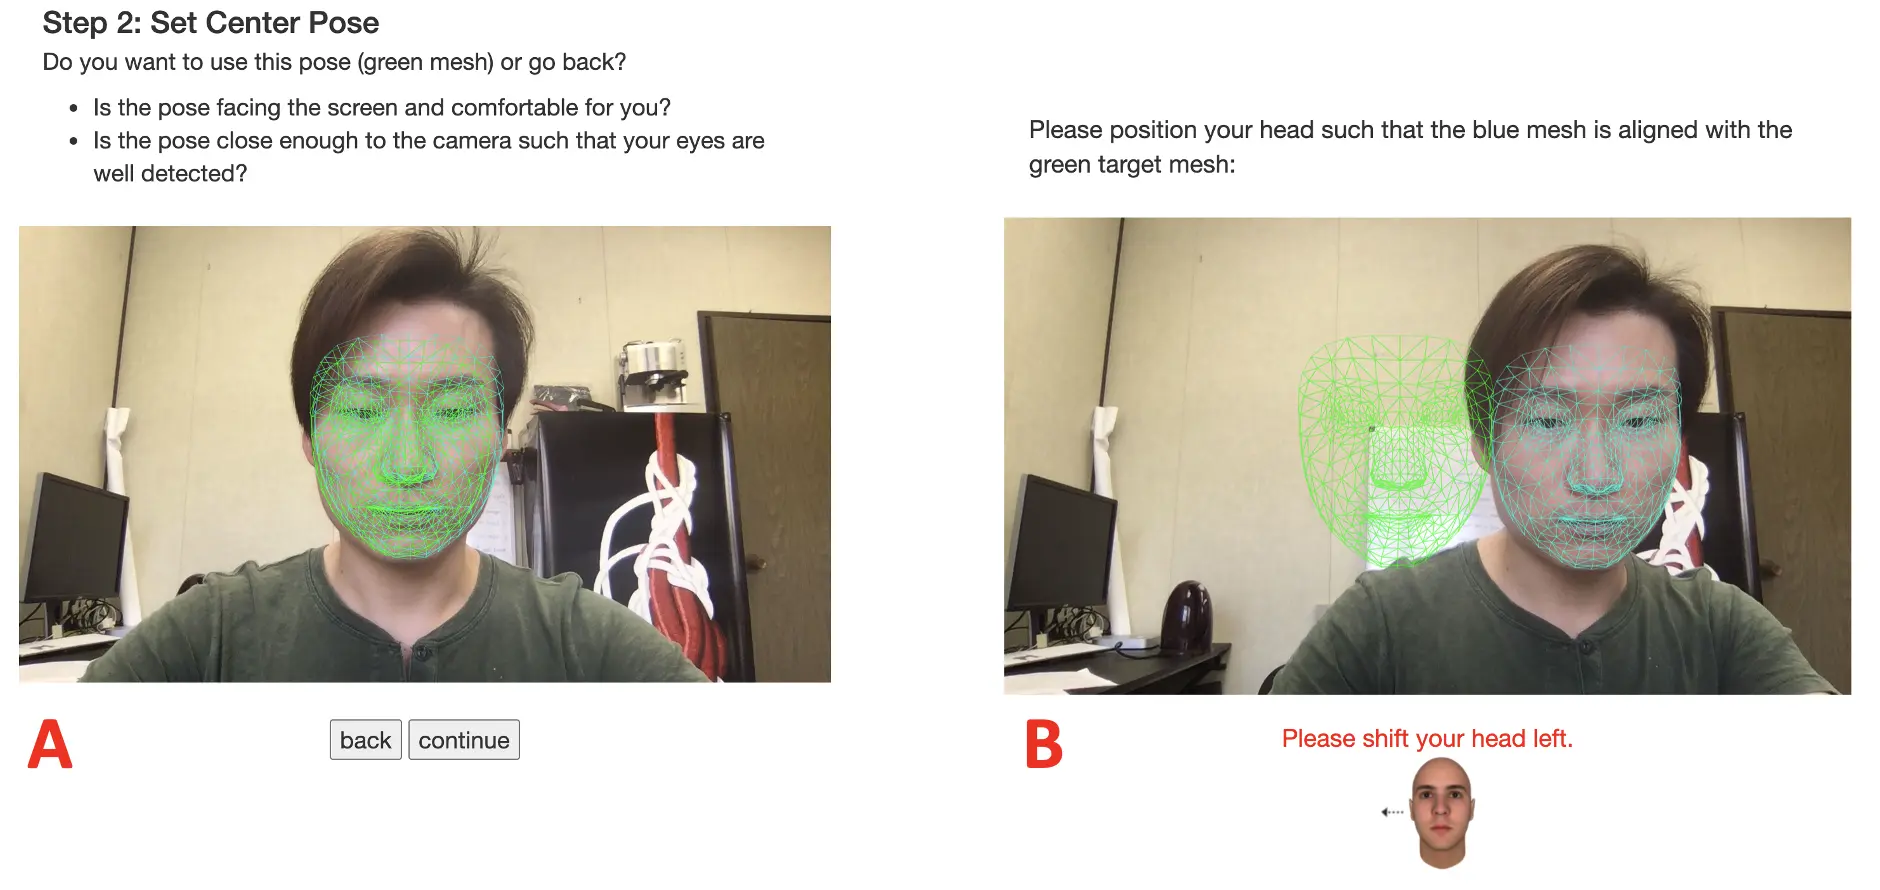 Figure 13. Display of head calibration process with the green “virtual chinrest” mask. The first image (A) displays the initial center pose determination. The second image (B) shows a head location discrepancy and the program’s dialogue to reposition the head to the green virtual chin rest.
Part IV: Dataview
After the participant run(s), the recorded eyetracking data can be viewed by clicking on the Dataview & Export page (see Figure 14). For Labvanced, the platform provides two types of datasets that the experimenter can download: Normal data and Time Series data.
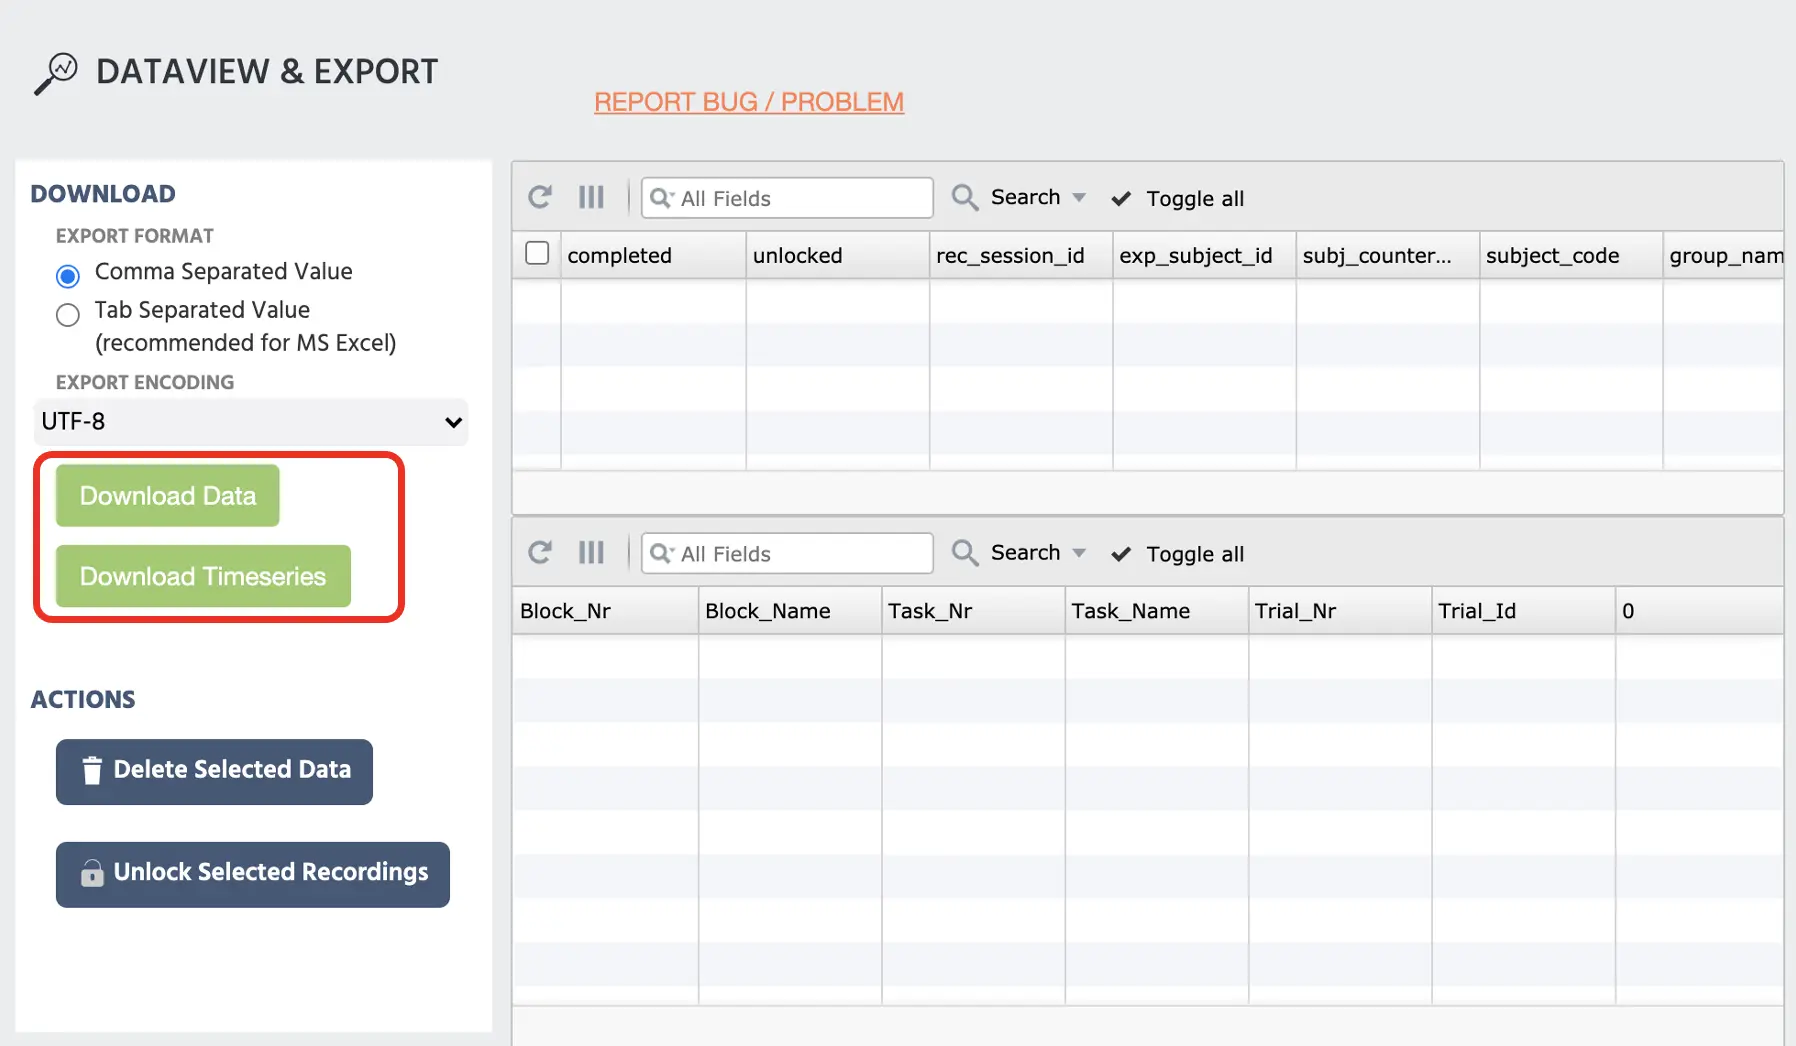 Figure 14. Dataview display where the standard data and timeseries data can be downloaded in red box.
Normal data
This is a conventional structure of the dataset that will display each variable in columns, and each row will represent each trial. The dataset will always include a unique participant ID for each respondent and identification if such was required in the study. One thing to note in this dataset is that the Calibration error (Calib error in the Figure 15 below) indicates the general eyetracking data that was obtained during the main calibration. Therefore, this value will remain consistent throughout the entire dataset. For the error trial column, it will display some continuous values that will vary throughout the trials. Ideally, a decrease in this column throughout the trials indicates a decrease in error variance of the measurement, which is a good indication of the overall confidence of the obtained measurement.
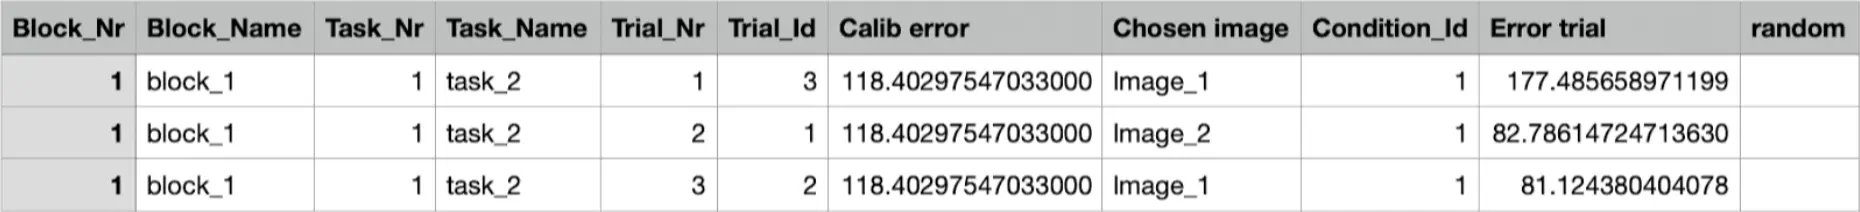 Figure 15. Incomplete normal dataview display with some of the columns indicating critical variables: trial number, calibration error, chosen image, and error trial.
Timeseries data
This is a longer depiction of the dataset that portrays multiple measurements within each trial processed by the webcam (as well as mouse tracking as needed). Therefore, this dataset will indicate multiple rows for the same trial and the last four columns (see Figure 16 below) indicate the [X, Y, T, C] array data we mentioned in the previous part of the Events variable setup. These for columns indicate as follows:
- X = X-position of the gaze in the unit of frame coordinates
- Y = Y-position of the gaze in the unit of frame coordinates
- T = precise timestamp (UNIX time) when the gaze occurred
- C = confidence for the respective gaze data
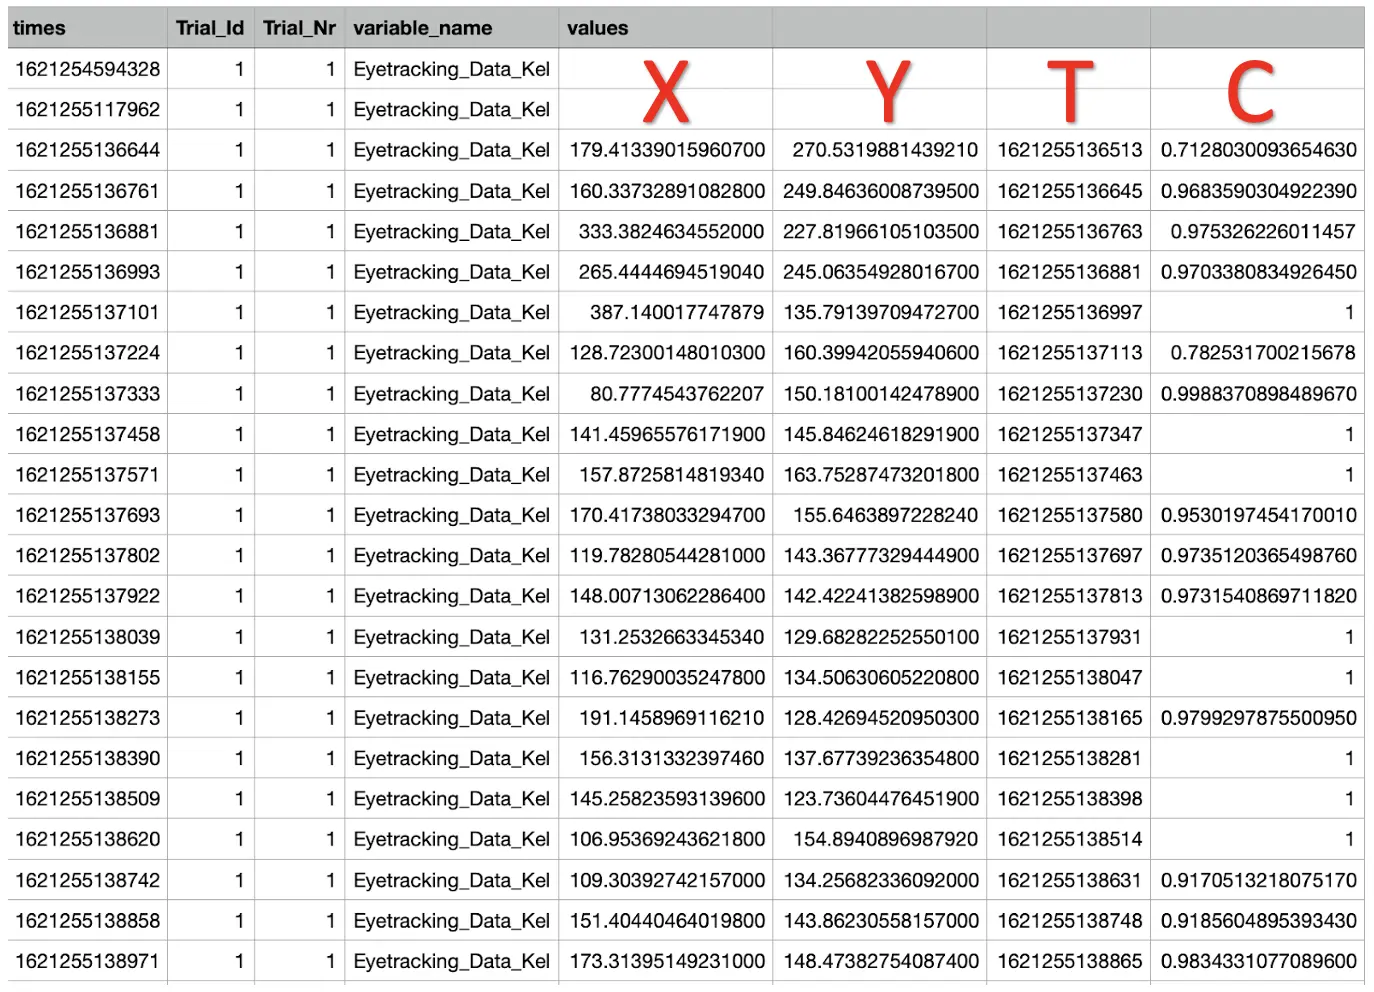 Figure 16. Incomplete timeseries data view display with the last four columns of: x-coordinate, y-coordinate, UNIX time, and confidence scores.
For the X & Y coordinates, this raw gaze measurement data could be evaluated with the main study frames to extrapolate where the participant was looking during this event. In the main canvas, the standard frame setup is 800x450 frame coordinate units (see figure 17 below). Therefore, by clicking on the object, the experimenter can extrapolate its relative X & Y position in the screen to infer whether the participant’s gaze landed on the stimulus - allowing the area of interest (AOI) calculation.
For the last confidence data, this informs how well the eye was detected using the webcam, considering the iris/pupil detection and blink detection. The values will vary within the interval of 0 to 1, where scores approaching 1 indicate the good measurement’s robustness. The value that is lower and approaching 0 is considered less confident or reliable data, as this could be indicative of retinal blur during a particular head movement or blink detection during this measurement.
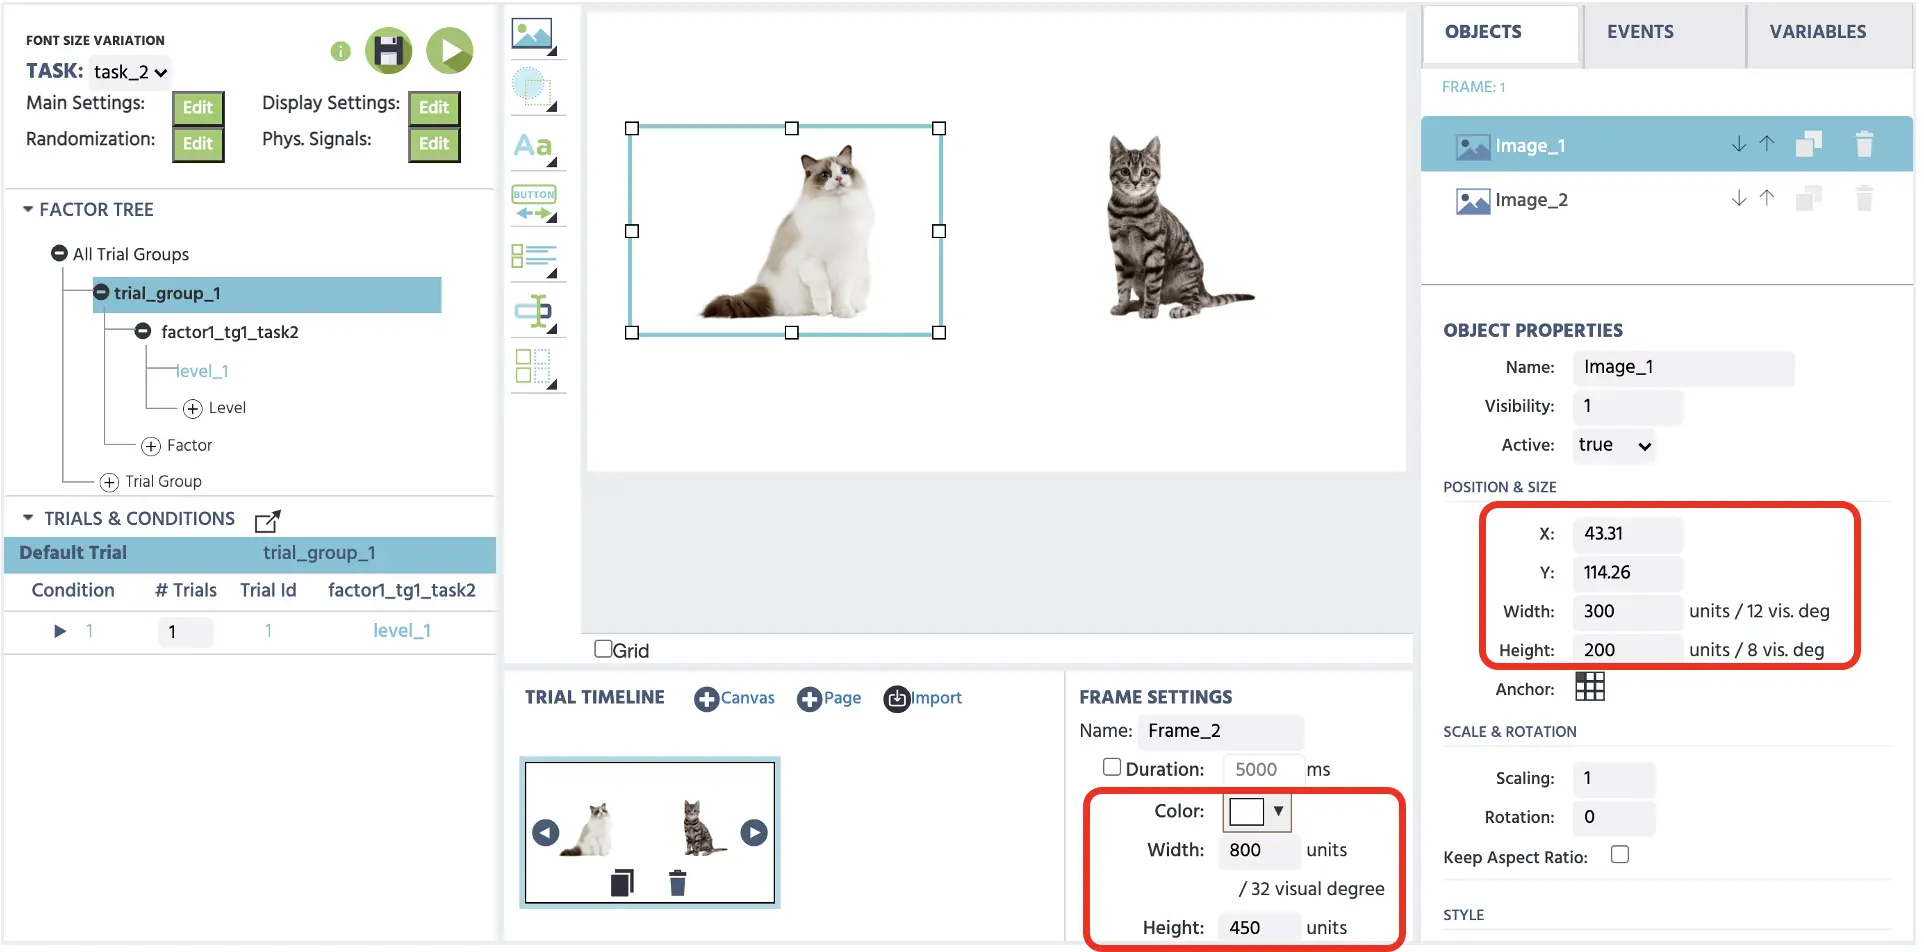 Figure 17. Display of canvas page. The first red box at the bottom displays standard frame measurements of 800 x 450 frame coordinates. The second red box on the right displays the x & y coordinate position of the first cat image that could serve as the area of interest (AOI) for the analysis.
As a final note, the Labvanced sampling rate cannot go above 30 frames per second. We aim to improve this in the future, but it is important to note that most webcams currently have 30 frames per second threshold. Lastly, on our Github repository, we currently have multiple scripts that could be useful for WebSocket & data analysis. We hope to provide more scripts in the future, and we are currently working on a new algorithm to calculate the fixation detection that could be greatly useful for ocular-based experimental studies.