Desktop App Study with EEG Integration
Contents:
Overview
The aim of this walkthrough is to demonstrate how to set up a simple study with EEG integration using the desktop app.
Note: For more information about the desktop app, including an installation guide and an overview of the app functionalities - refer to this page.
Note: For more information about the desktop app, including an installation guide and an overview of the app functionalities, refer to this page.
Settings
In Settings tab, under the Special Features column, scroll down to the Lab-Streaming-Layer option and activate it. For more information about these settings, visit this page.
Then this text field will pop up where you can name the output stream. Here, we created a single stream and kept the default name and options.
Typically, you want to set up an output stream for the events generated in Labvanced and send it as a marker stream to your EEG recordings to mark events so you can do events-related analysis of the EEG data. After this is set up, you can send individual markers on that stream which is quite straightforward using the Labvanced event system.
Simple Study Set Up
For the purposes of this walkthrough, we will quickly set up a study for the bouba-kiki effect in order to have a basis of discussion and a foundation for setting up the EEG-related events for sending markers based on:
- What stimuli category is being displayed (ie., bouba category= round shapes; kiki category= spiky / sharp shapes)
- When the image was clicked
To see how we set up the stimuli (for context), refer to 04:19 minute mark in this video:
Quick description of stimuli upload process (based on the video above):
- From the trial system, we create the level and name it ‘bouba’ which will be for the stimuli images of round shapes and then create another level and name it ‘kiki’ for the spiky shape stimuli images.
- Now under the Bouba condition shown on the Trial System, we click it and select the object then upload our relevant image files, selecting the options to: i.) create as many trials as there are stimuli and ii.) auto-assign them.
- Then, we do the same for the other condition by selecting the object under the condition and repeating the process.
At this point we have a simple study with two kinds of stimuli. After we set up the events (upcoming section), the final task will look like this with a click on the image navigating the study forward to the next trial, while sending EEG markers.
Events Set up
Now for the events, the main idea is that we want to send an EEG marker based on what kind / category of image the participant is seeing, as well as a marker for when the image was clicked.
Event 1: Send Marker (Frame/Stimulus Onset) to EEG
For this first event, we want to EEG to know: a) when the frame with the stimuli started, but b.) also from which image category the stimulus belongs to (ie. bouba or kiki).
TRIGGER
Trial and Frame Trigger→On Frame Start
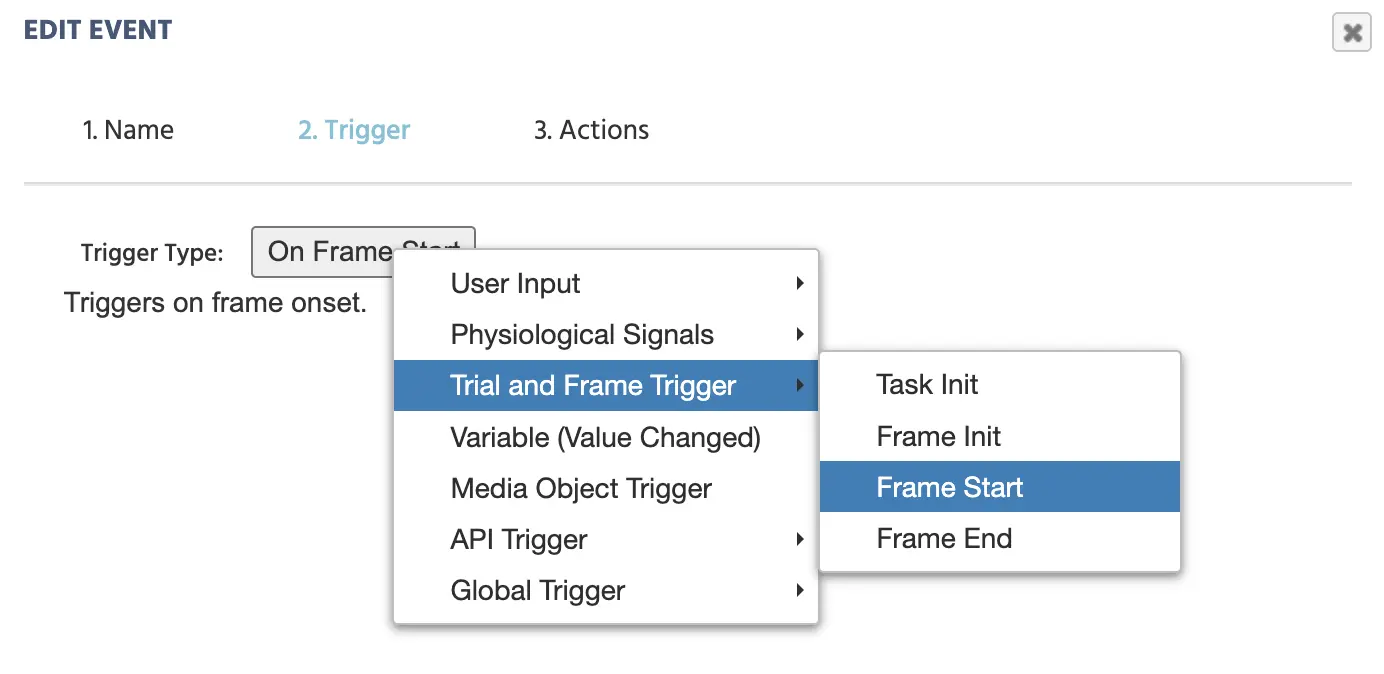
Selecting Frame Start as a Trigger for when the first EEG marker should be made.
ACTION
Since we want to switch between conditions, we will need an if/then action, in the editor:
Control Action→Requirement Action (If…Then)
To specify the first condition, we call the corresponding factor variable and set it equal to 'bouba.' This is done by applying the following steps in the editor:
- Click
+ Requirement - In the left pencil icon:
Variable→Select Variableand chosefactor1_tg1_task0 - In the right pencil icon:
Constant Value→String→ type in the string bouba
Note: In the experiment design process, you should give your factors unique and descriptive names. In the example above we used the default name factor1_tg1_task0 but for structurally sound designs, you should give your factors more accurate names to reflect the category (like ‘Shape’).
Once this IF condition is met, we THEN want the following to happen:
Add ActionAPI Actions→Send LabStreamingLayer Marker- Select the stream that was created earlier under the ‘Study Settings’ for this purpose (ie. the labvanced_stream_1)
- Value to send:
Constant Value→String→ type in the word bouba
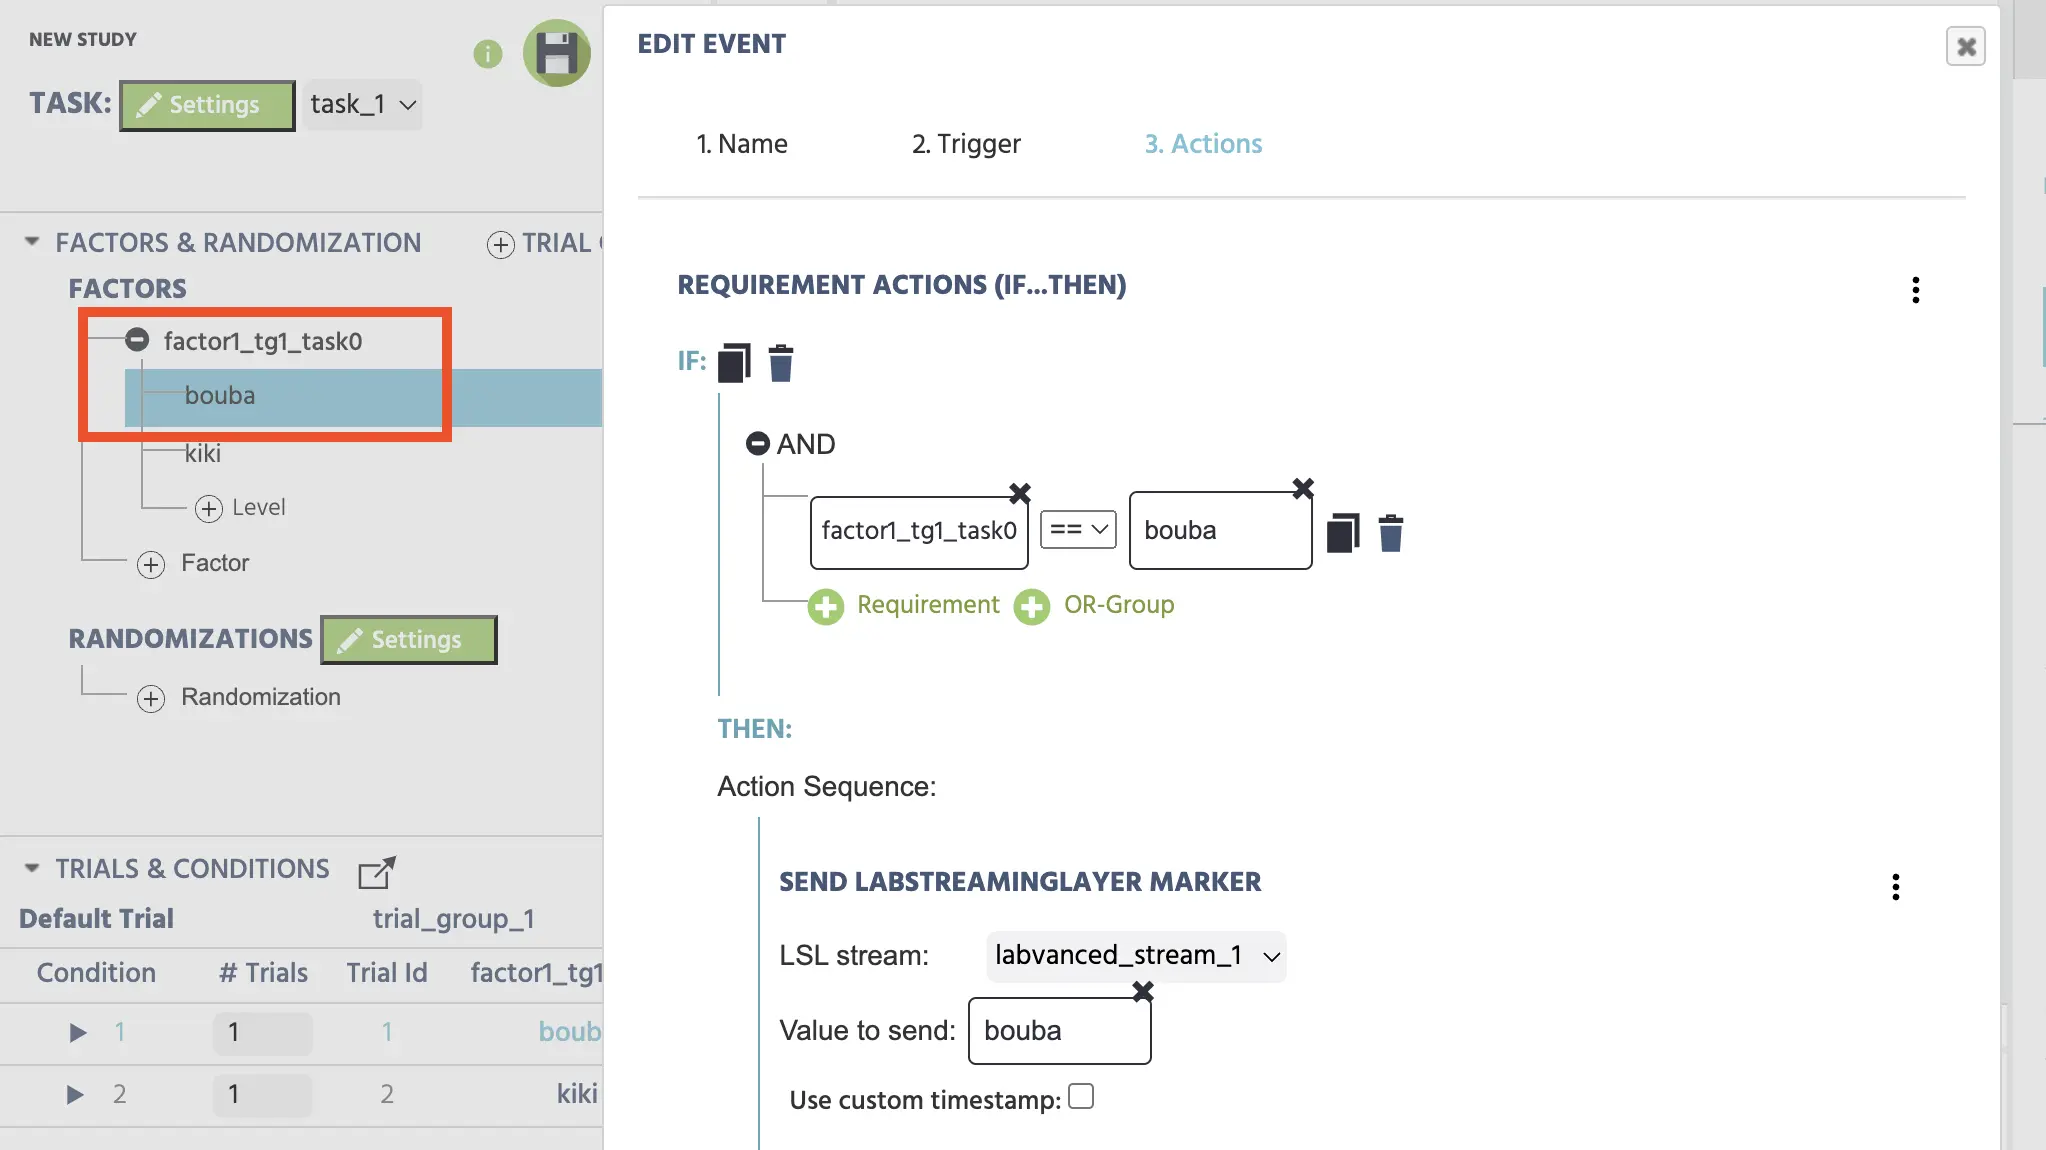
Specifying the LSL marker based on the image stimuli condition type.
We repeat the process for the kiki condition by clicking the + Add Else If Case option.
Workflow tip: Instead of creating a second event for the ‘kiki’ condition. Just copy the event above (using the duplicate icon at the top, next to the word `IF`) and simply change the strings to correspond with the other factor or stimulus type, ie ‘kiki’.
SUMMARY
Up to this point, we set up Labvanced to send an EEG marker (based on the stimulus shape type) as soon as the frame starts, ie. as soon as the stimulus is presented.
Event 2: Participant Response
Now we want to send a marker and measure something that’s more dynamic, ie. when the image was clicked. Here, we can also quantify reaction time and move forwards to the next trial (all based on the mouse click on the image).
We can create another event, with the so when the image is clicked, the EEG receives the marker of ‘click’.
TRIGGER
User Input→Mouse Trigger+ Add Target→ select the image object (image_1)
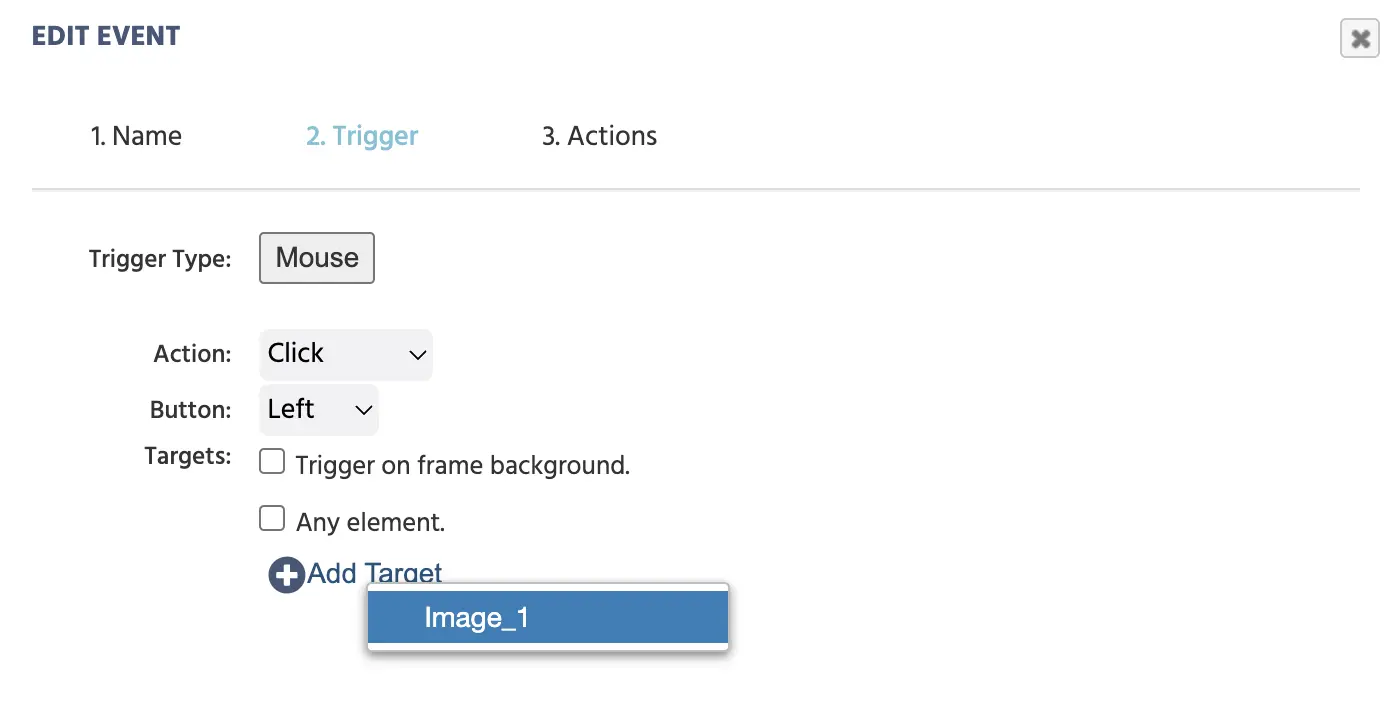
Selecting an image click as the trigger for when the second marker should be created.
ACTION 1 (Send ‘click’ marker to EEG)
Create a new marker by:
API Actions→Send LabStreamingLayer Marker- LSL Stream: select
labvanced_stream_1 - Value to Send:
Constant Value→String→ type in the word Click
ACTION 2 (Record reaction time)
Use the Set / Record Variable and creating a variable that is scalar and numeric which records the mouse trigger time from the frame onset by:
+ ActionVariable Actions→Set / Record VariableSelect(green button) →+New Variable(top right)- Name: RT
- Format: Scalar
- Data Type: Numeric
- → ‘OK’
- Pencil icon →
Trigger (Mouse)→Trigger Time (From Frame Onset)
ACTION 3 (Jump to next trial)
+ ActionJump Actions→Jump To→Next Trial
Following this procedure, your event will look like this:
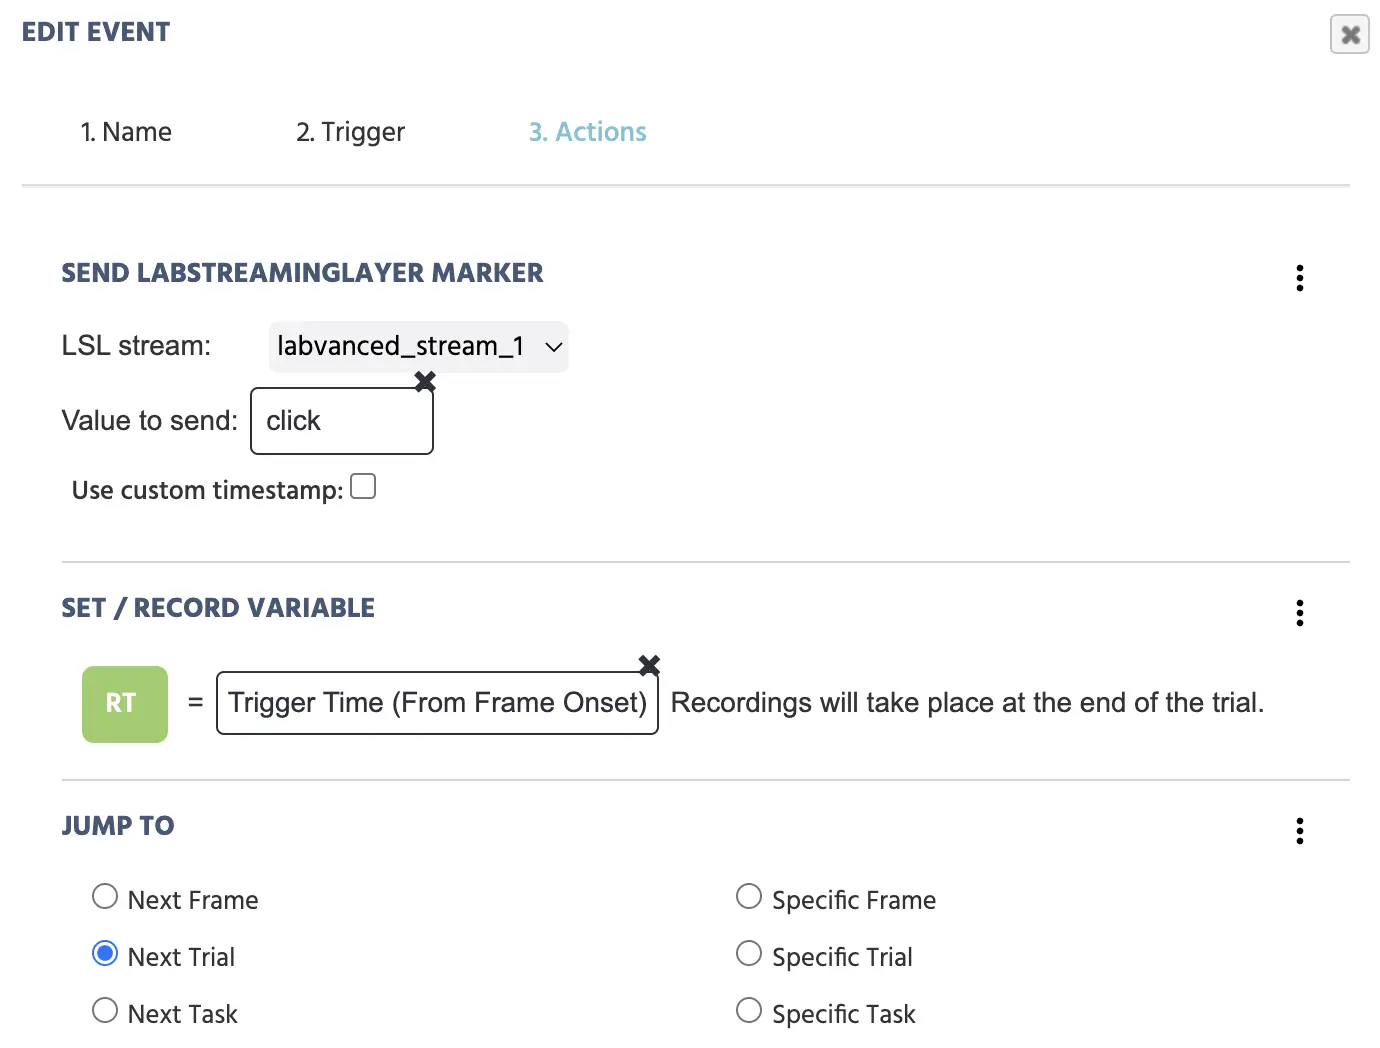
Three actions are set to occur upon a mouse click on the target image: i.) sending the marker to the EEG, quantifying reaction time, and moving to the next trial.
SUMMARY
The event above, with the trigger of clicking on a specific image, has the following actions follow suit: a marker straight ‘click’ is sent to the EEG, a reaction time (from the frame onset) is recorded in milliseconds and stored in the variable ‘RT’, and the experiment moves on to the next trial.
At this point, a very simple study is set up with a structure and capabilities of sending markers to an EEG!
- Two different stimuli types
- EEG receives markers based on:
- stimuli type displayed
- when the ‘click’ occurred
- The study records reaction time and has navigation set up
LOCAL MODE
In the desktop app now, toggling back to the ‘local’ mode shows that there is a sync happening.
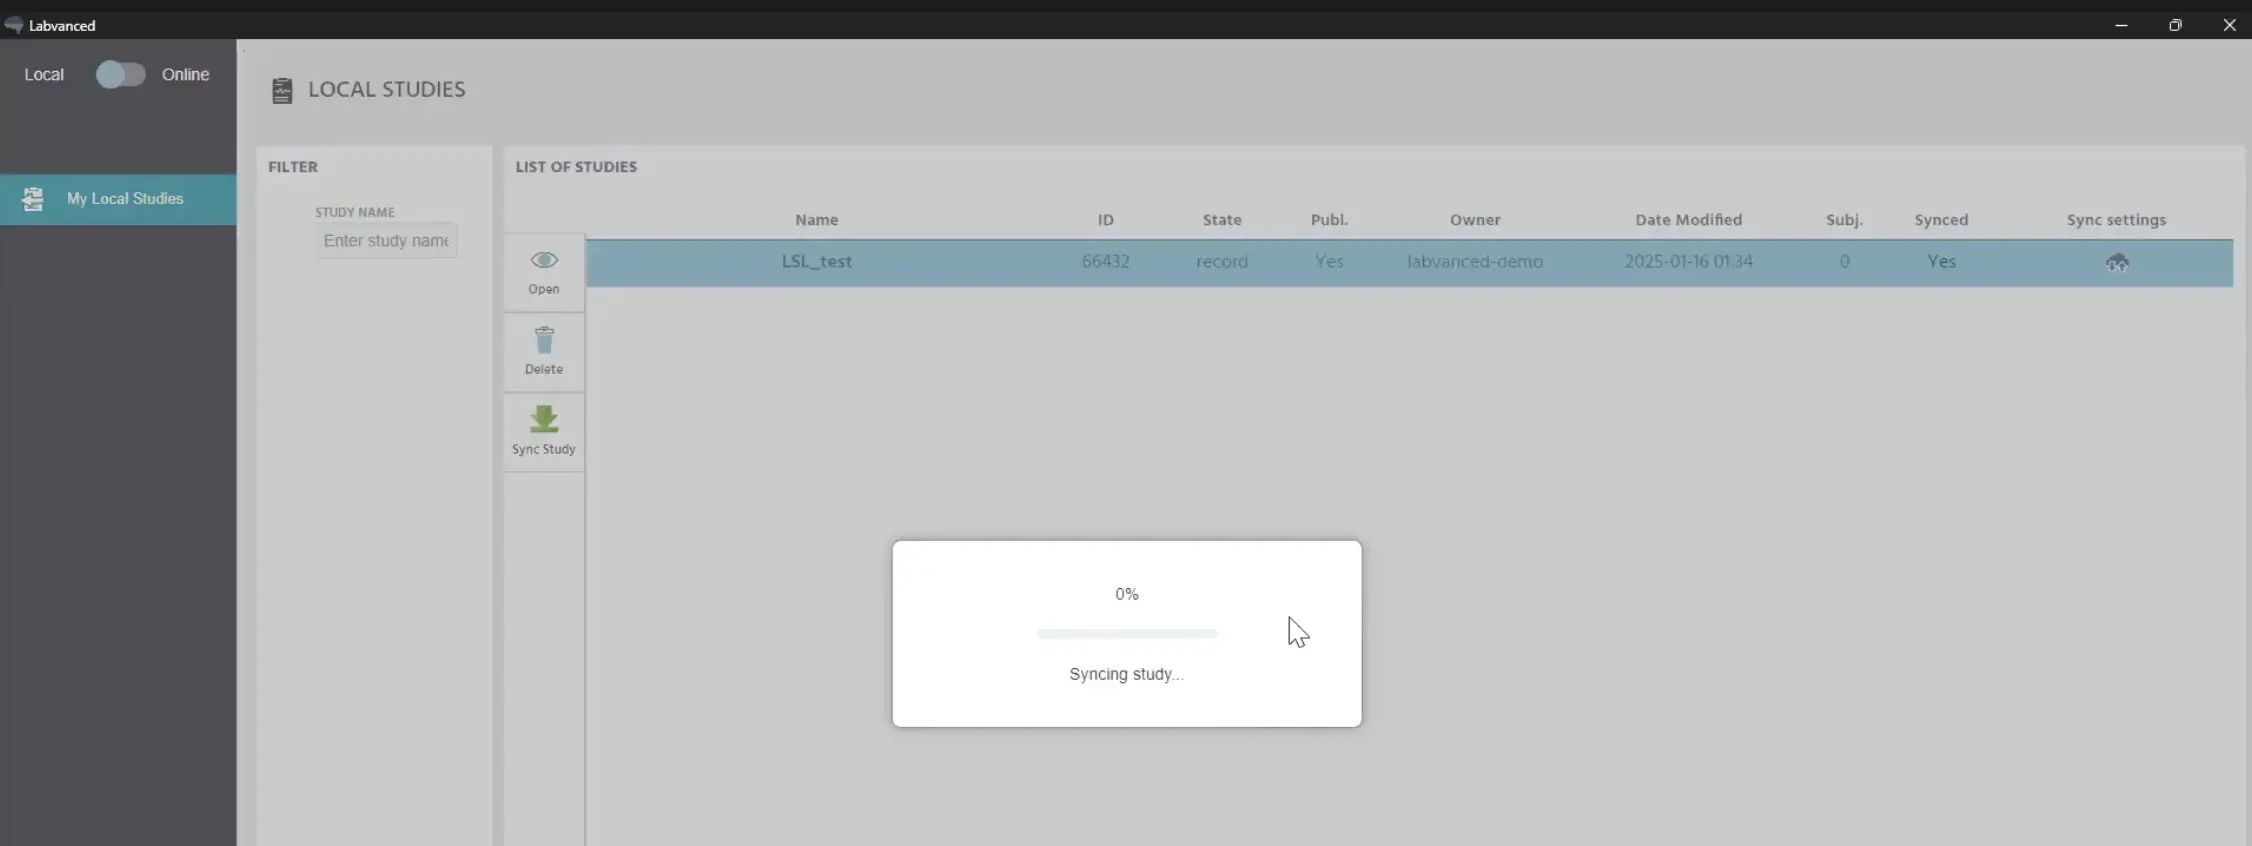
The study is loading and updating locally on the desktop app.
After a few seconds, the updated study has been downloaded so all the changes made online are reflected in the local version.
Let’s move on to an EEG Recording session.
EEG Data Recording Session
To start an EEG Data Recording session, of course we need the Labvanced study we made above (with its structure and events for sending the markers). But we will also need a few supplementary programs (free) in order to infuse the EEG with markers, as well the tools to visualize and potentially analyze the data.
EEG Equipment (Muse 2 EEG)
In this demo, we are using a Muse 2 EEG wearable headset. With the BlueMuse (free) program open (for the Muse 2 EEG Headset), we click the ‘Start Streaming’ option. A second window will pop up showing 4 different streams: the EEG channel, accelerometer, gyroscope and so on, as well as their respective sampling rates.
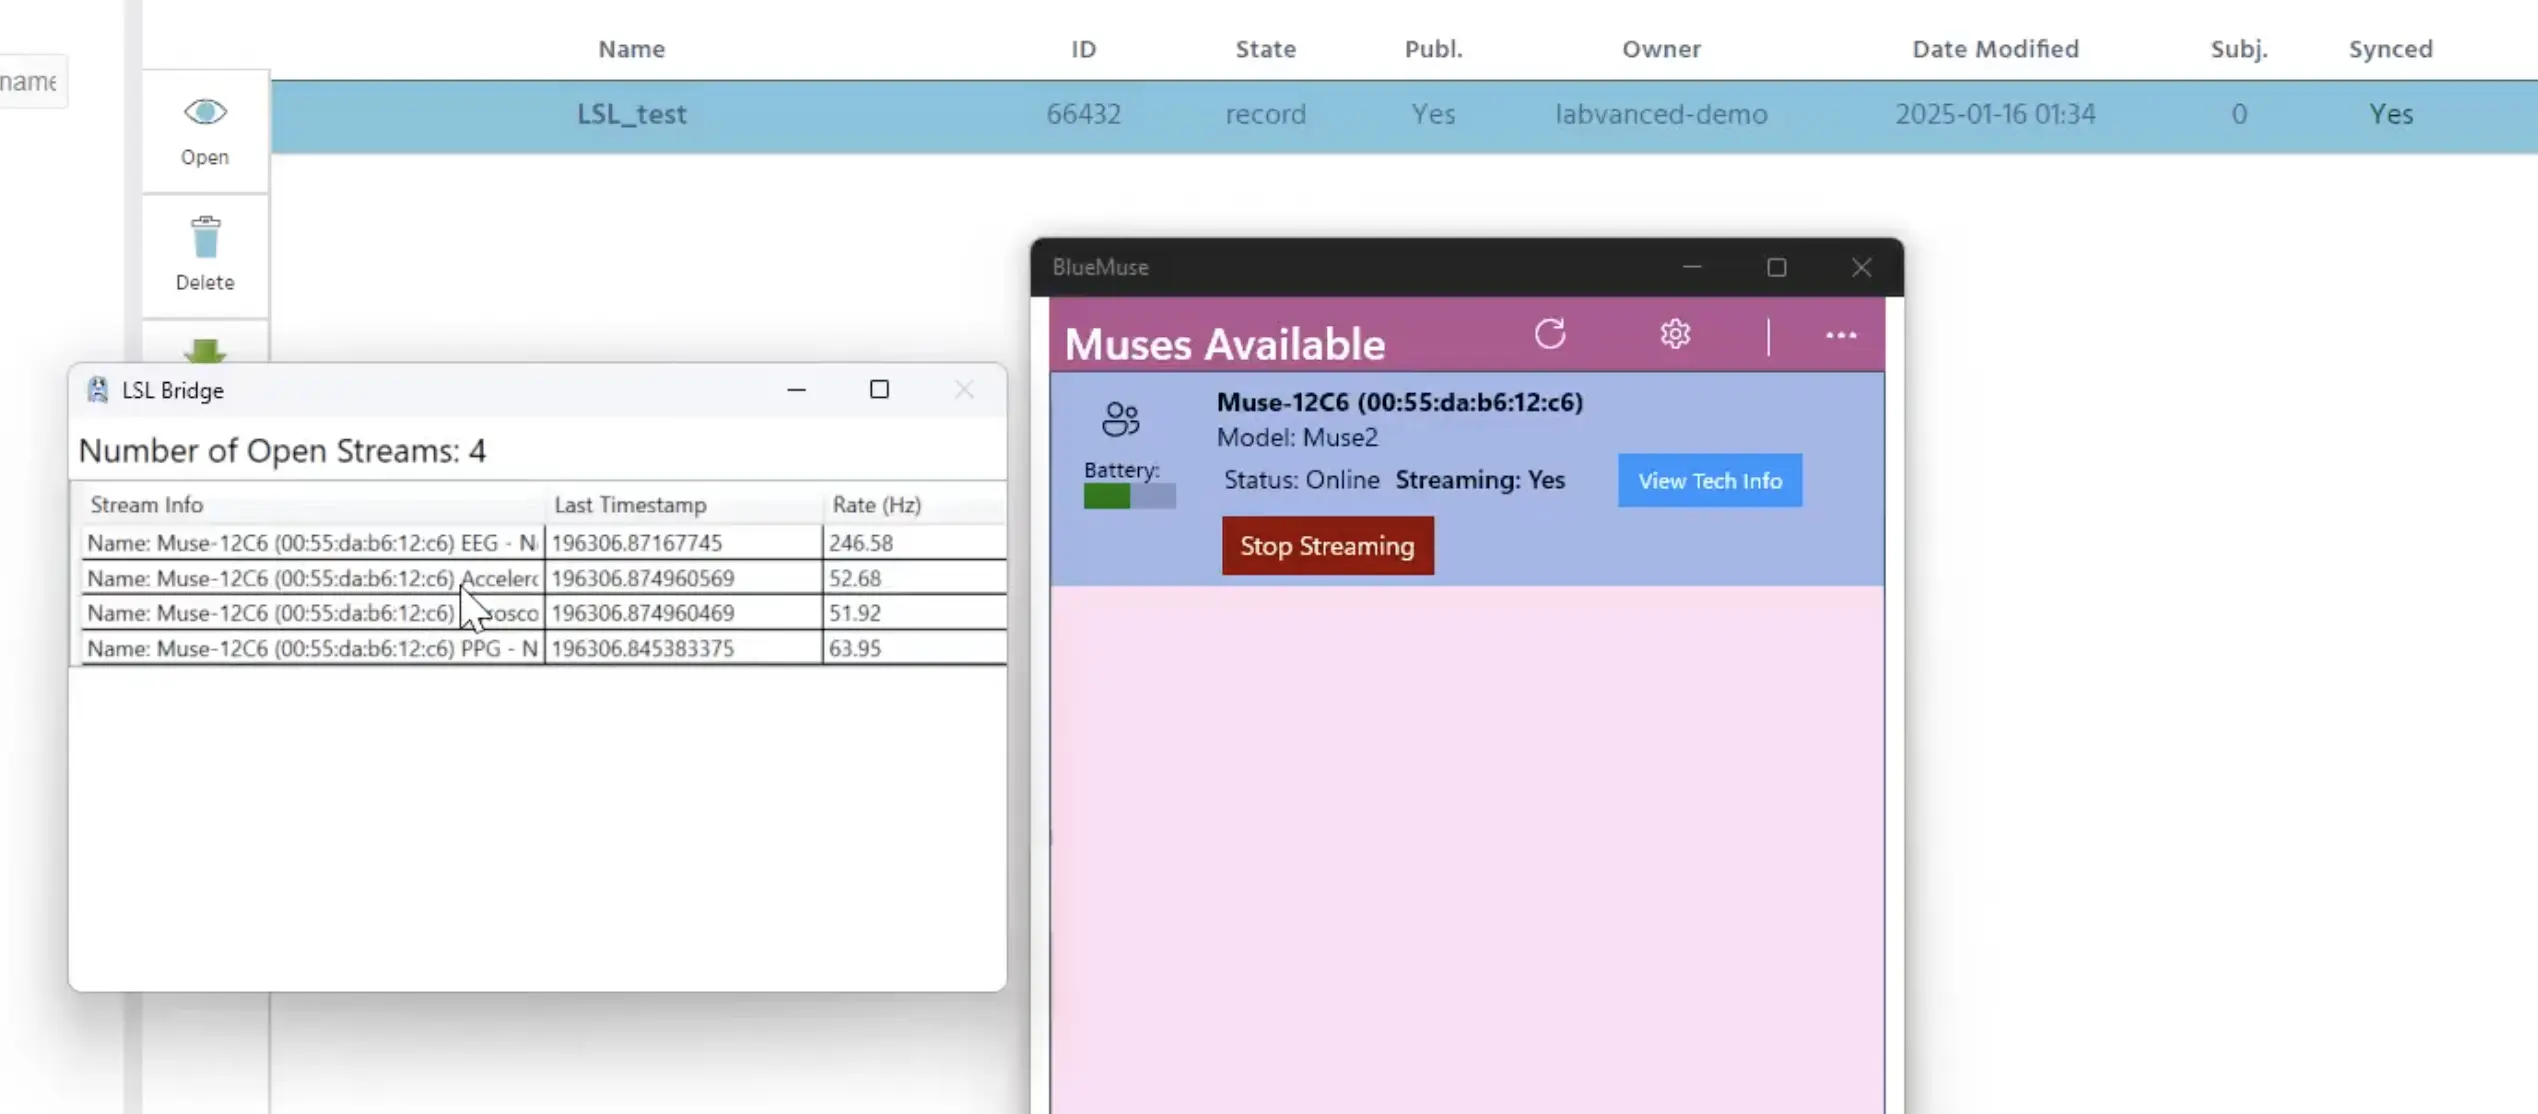
Starting streaming in BlueMuse (right window) and the streams appear (left window).
These two windows can be minimized now.
Lab Recorder
The next tool we will use is the Lab Recorder (free) which is the LSL recording software you can use to record the LSL data stream you just connected, as well as save it in an .XDF file.
If you have started your EEG system and started the LSL stream, you will see them here. At this point, the Labvanced stream has not started yet because the study has not started yet. So the study needs to be started in order for this stream to start as well.
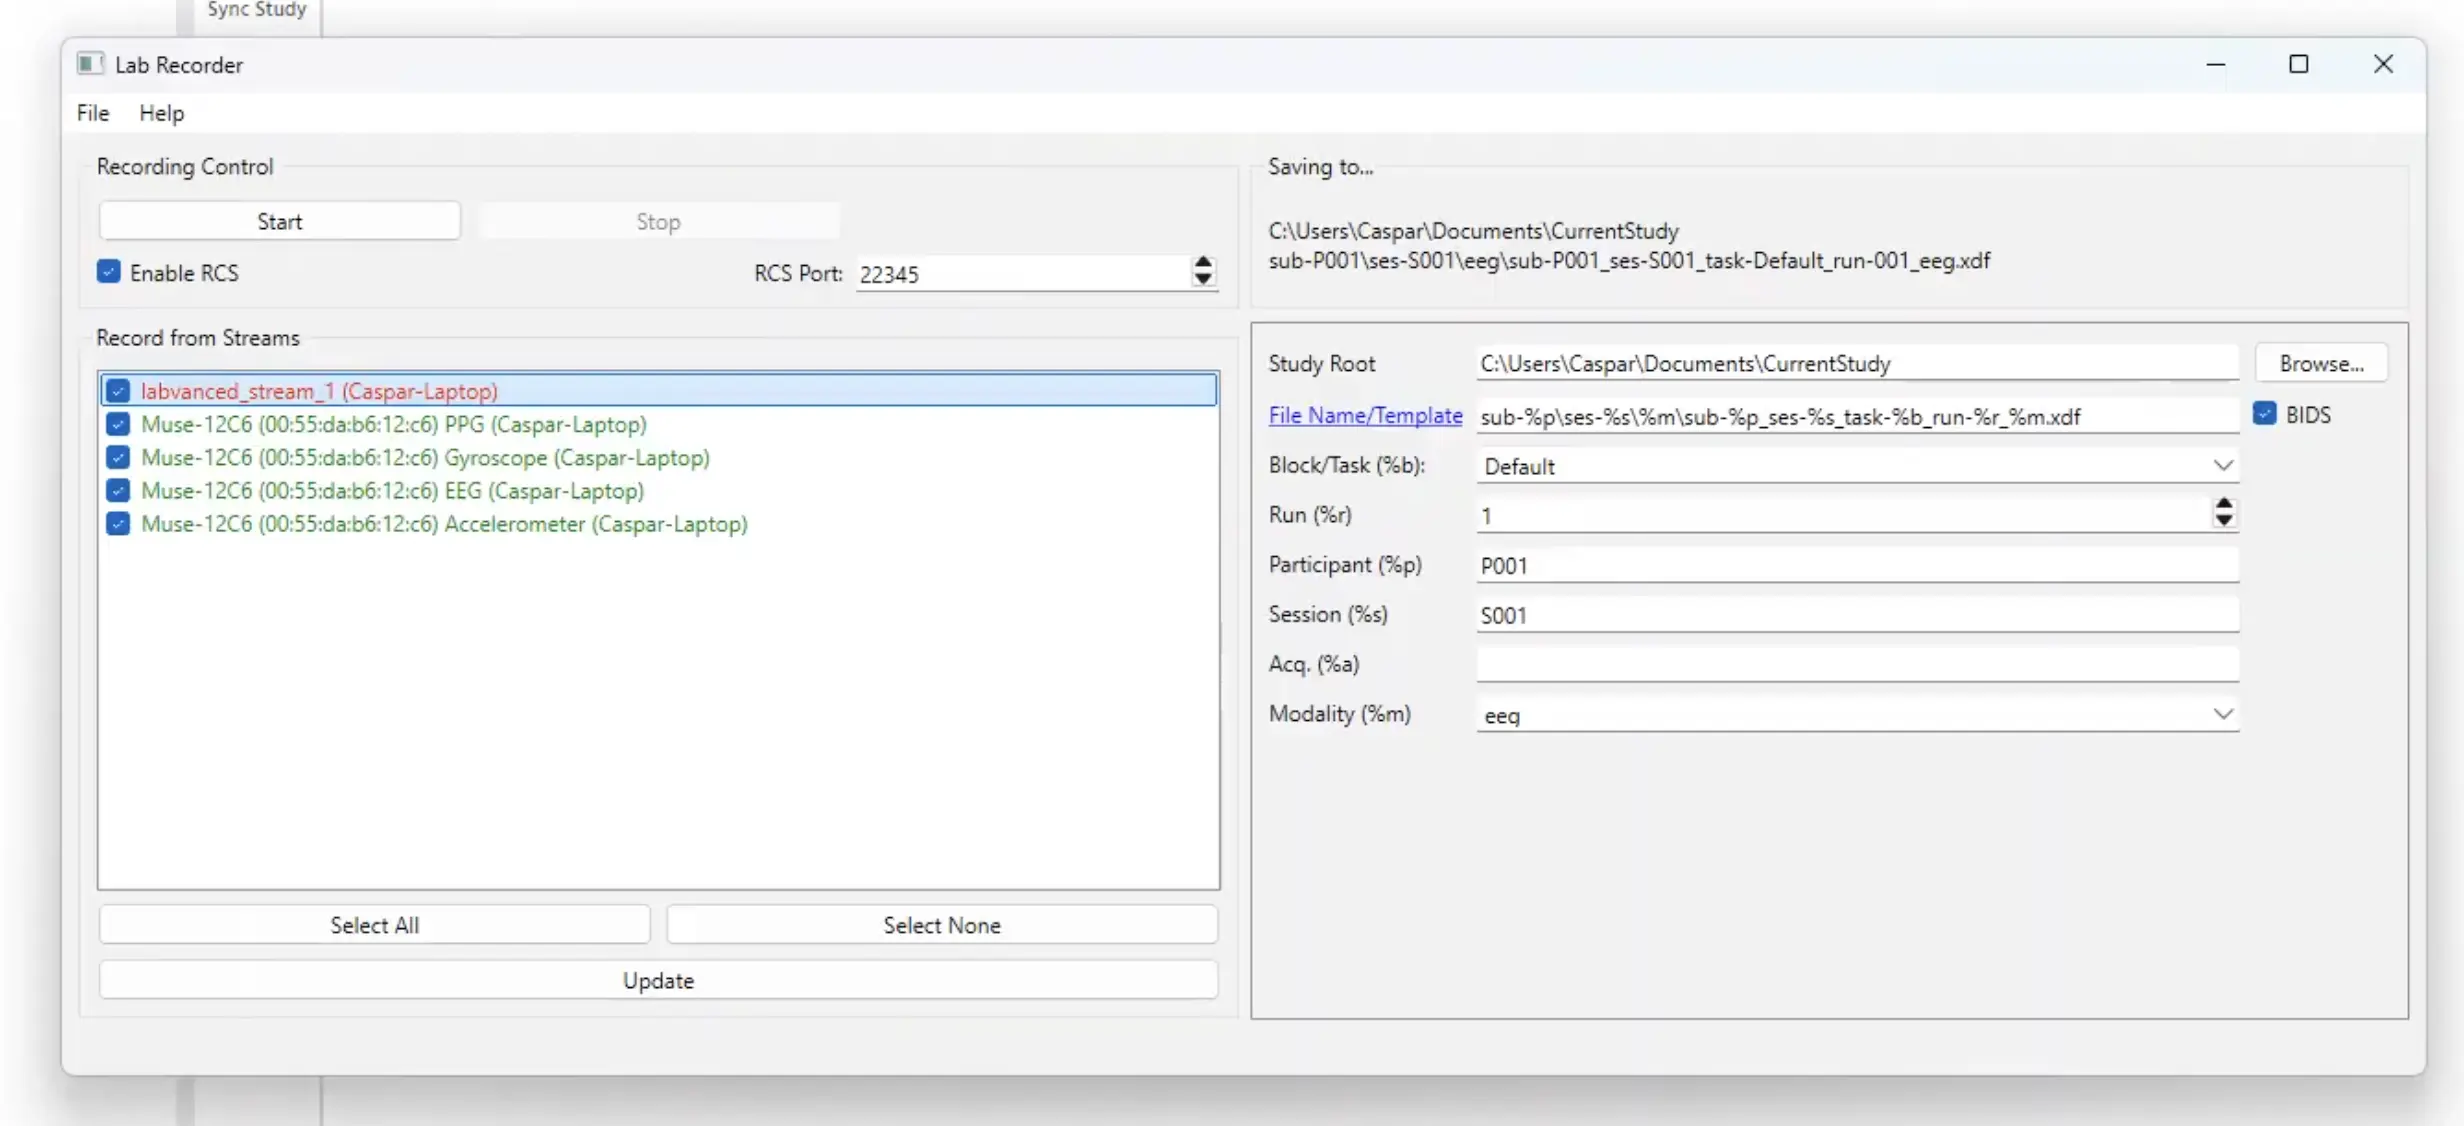
The top stream (in red) is not started because the study has not started yet. Starting the study will make this stream green. On the right side, you can specify where to save the data.
As soon as the study is started (ie. open the study in Labvanced and press Record). As soon as the study is started and in the waiting lobby, then you can click the ‘update’ button in the Lab Recorder and you can see the Labvanced stream is now ready.
Note: On the right side of the Lab Recorder program, you can indicate the file path and choose where to save the data stream file of combined data from the Labvanced stream and EEG and potentially other time series sources locally on your computer.
Now click Start in the Lab Recorder program (upper left corner) to start the recording.
Brain Vision
In order to see something, ie. the live feed of the LSL stream, you need to start another tool such as the Brain Vision Analyzer (free) from Brain Products that we use here which provides a nice visualization of what’s being recorded.
Upon clicking Connect all the streams should be displayed here. You can click on the Labvanced stream as well and click OK.
Now, we can start the experiment and start with recording and visualizing the EEG data!
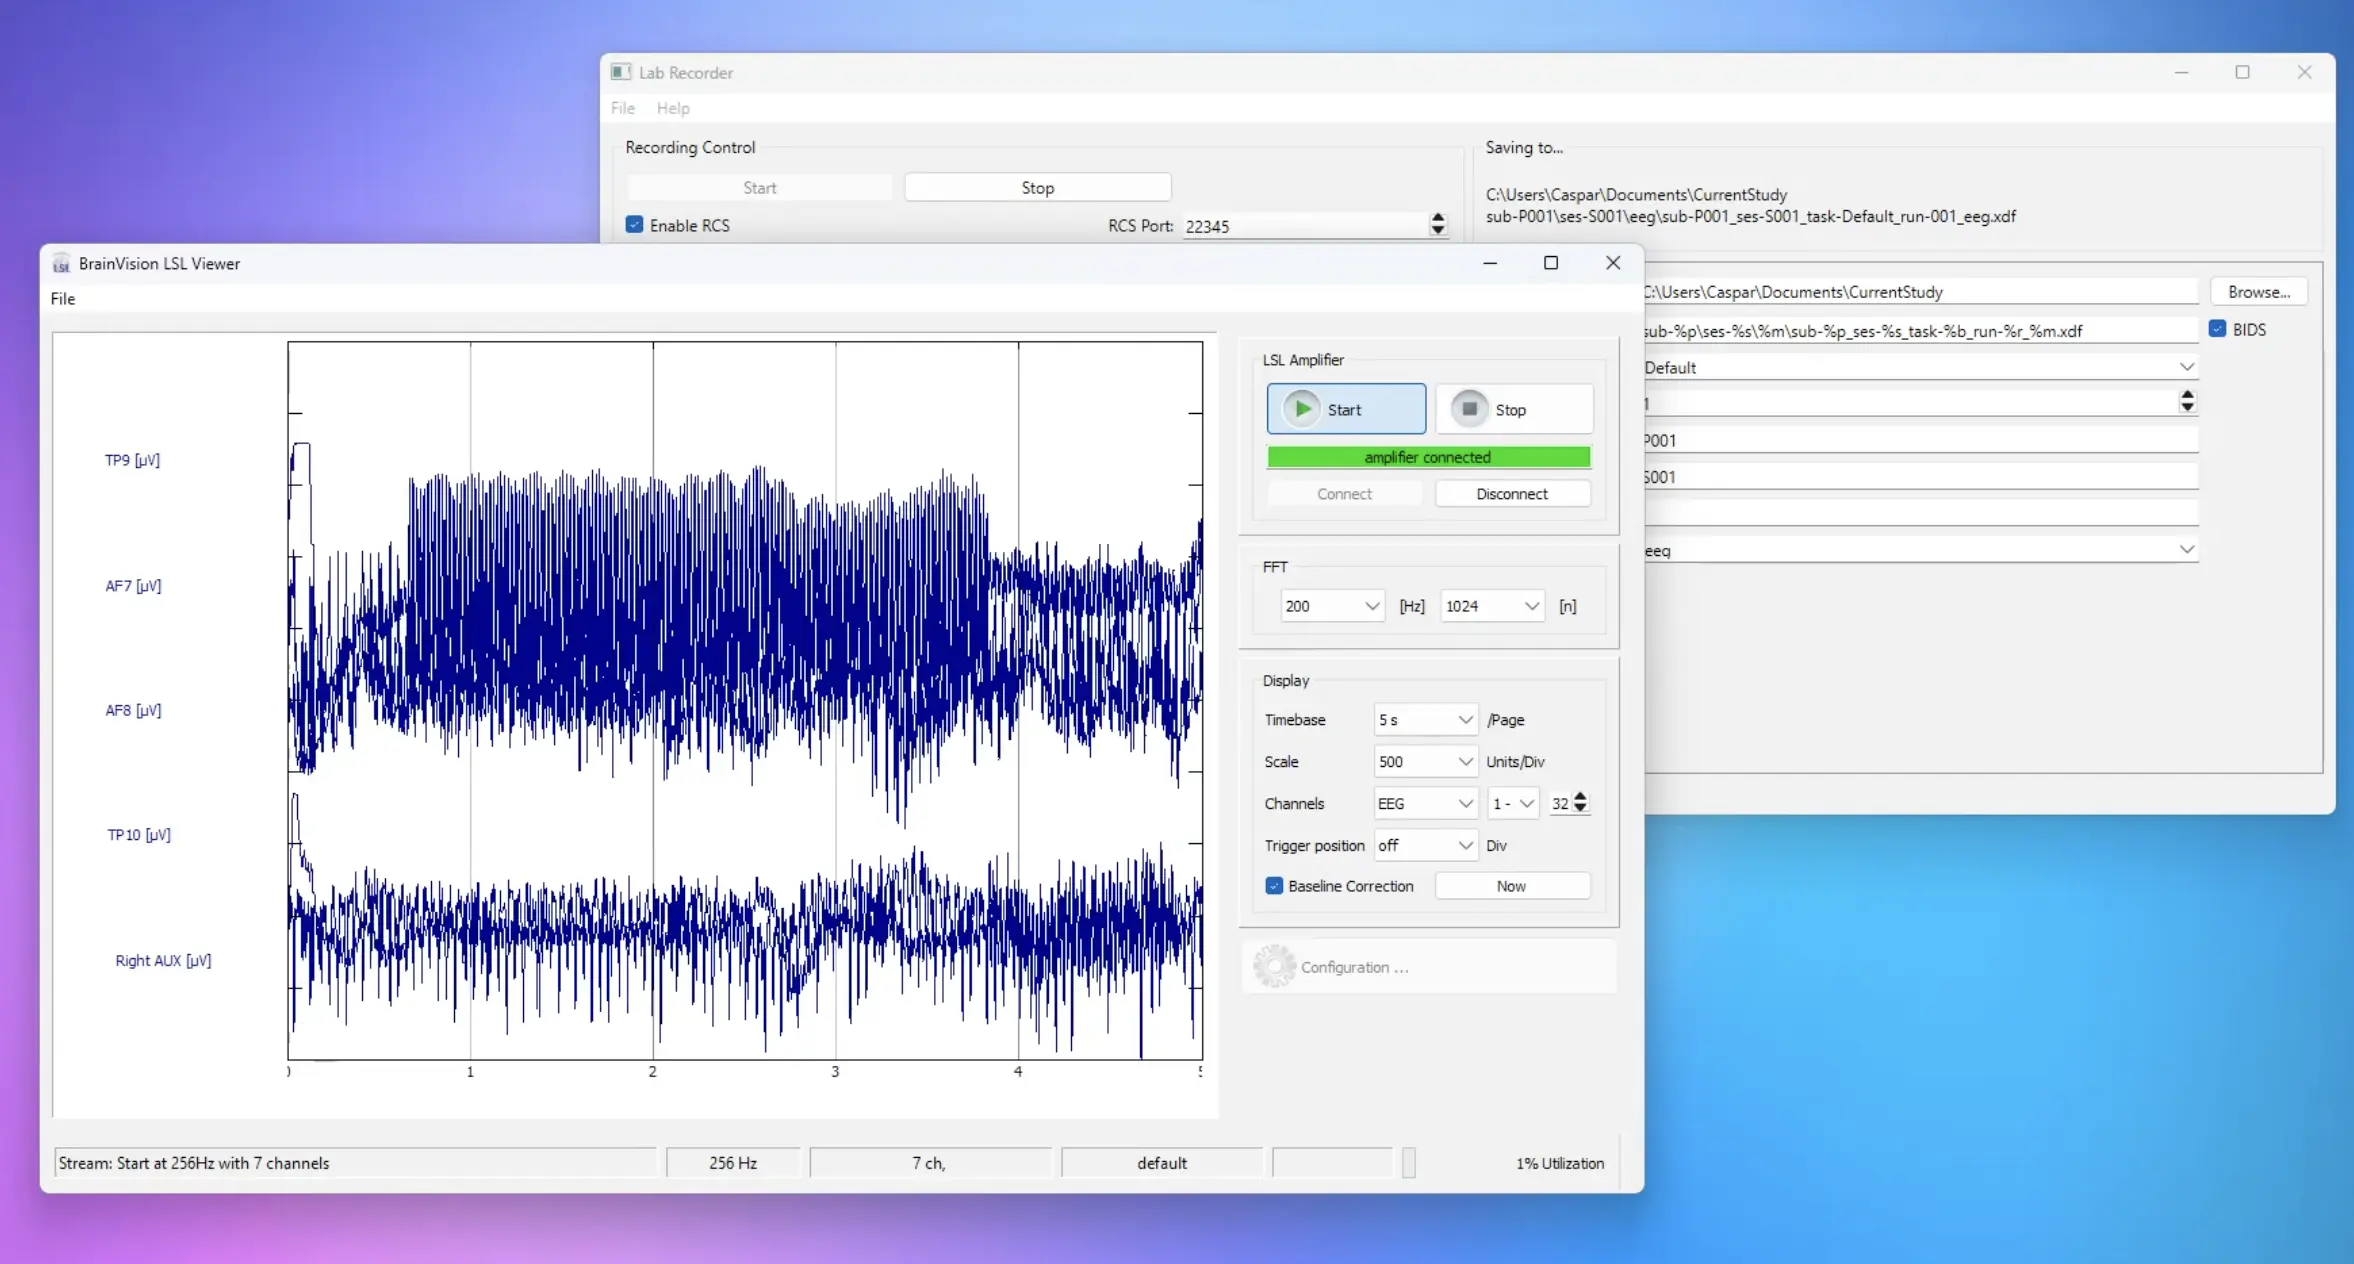
Preview of the EEG live stream in Brain Vision.
When there is a click or a response in the study, you will see the markers appear also in the EEG stream at the bottom of the Brain Vision program.
The ‘click’ marker and the condition marker are not so distinct on this scale. That’s because milliseconds after clicking the image, the condition marker is set for the new trial, so they appear together here, overlapping visually.
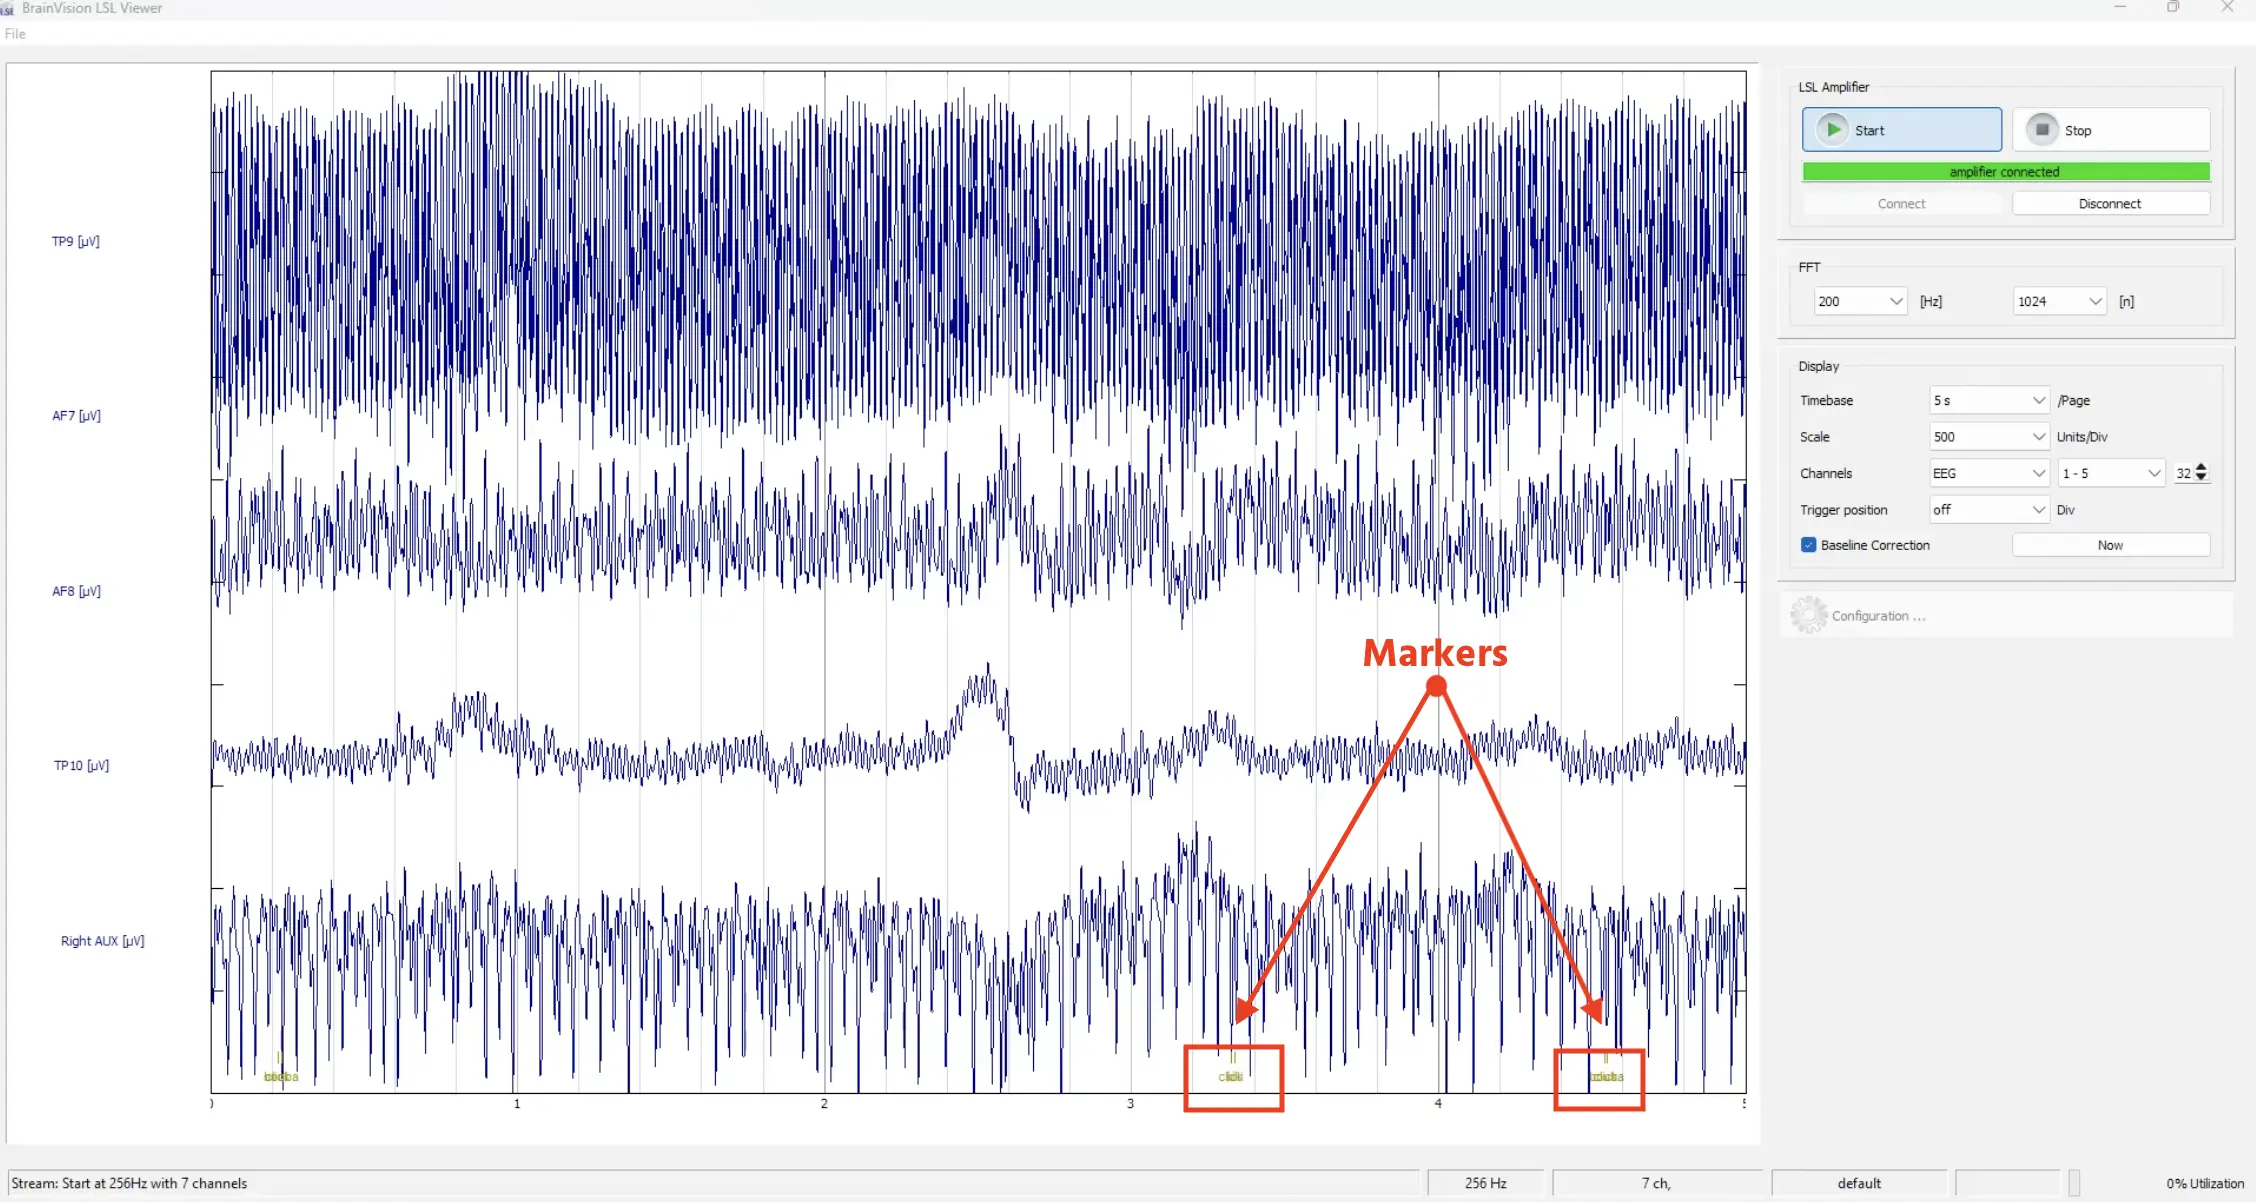
Markers created in Labvanced appear at the bottom, based on the condition type and click.
Overall, it works quite neatly!
Finishing the Recording
Now the study is done. So we can stop the data recording by clicking Stop in the Lab Recorder program. It takes a few seconds for the file to be created and saved.
EEG Data Analysis
EEGLAB Standalone
The last thing we want to show is how to analyze EEG data. Of course, there are many ways to analyze EEG data like in Python or in R or use MatLab.
We will use the EEGLAB Standalone (free) from the University of California - San Diego (UCSD) which doesn’t require MatLab or license, just a runtime environment so you can just directly inspect the data recordings.
With the EEGLAB Standalone options, all the plugins like those for loading the .XDF files (which is the output format from Lab Recorder) can directly be loaded.
From the File option, go to Import Data → Using EEGLAB Functions and Plugins → from .XDF to . XDFZ file file option and find the file from Lab Recorder in the local folder that was specified earlier to be saved. Then load it. Dialog boxes will appear to name the import and the dataset.
Once the file is opened, information will appear pertaining to the frames per epoch as well as the number of events and so on.
![Preview of the data set [test_1] from EEGLAB Standalone.](/content/learn/content_imgs/learn/walkthroughs/2025-01-desktop-app-study-with-eeg-integration/eeg_study_11.webp)
Preview of the data set [test_1] from EEGLAB Standalone.
We can go toPlot → Channel data (scroll) which is a nice overview of the recorded data and you can move through the data.
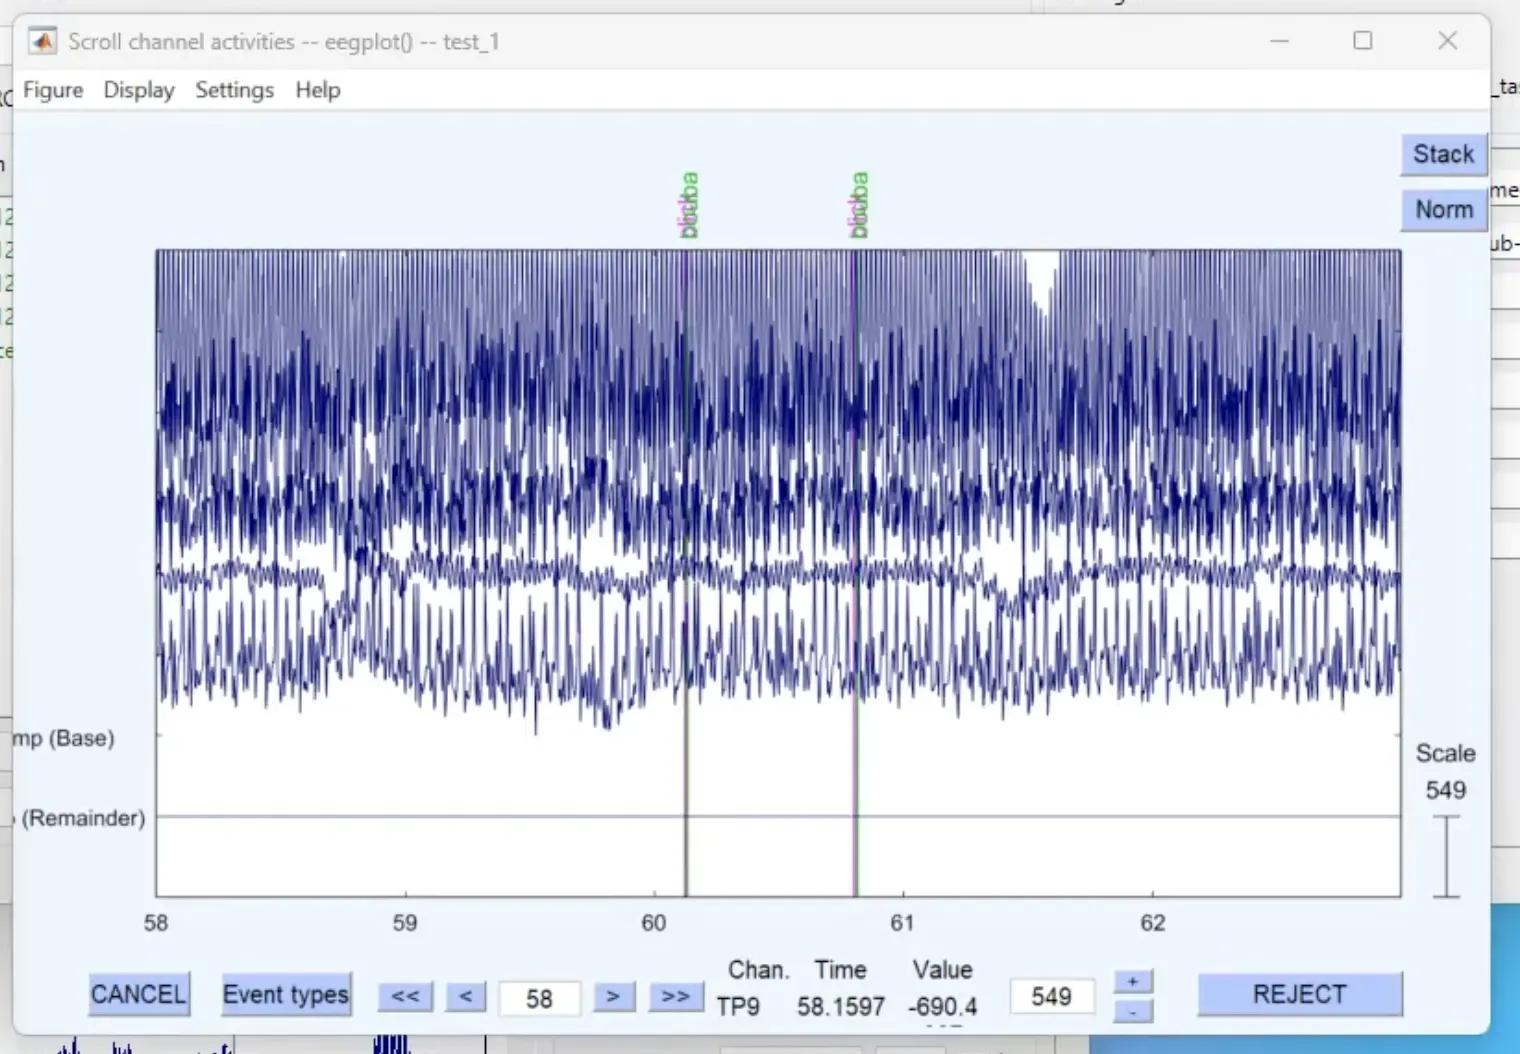
Opening the channel data and going through the recording session. Markers are listed in pink and green at the top.
We won’t be doing any analysis now, but from here you perform interesting operations using timestamps and epoch data sets. There are nice materials and tutorials from EEGLAB covering a wide range of topics.
For example, under the Plot menu item you can see many options. This is some kind of spectrogram of the recording.
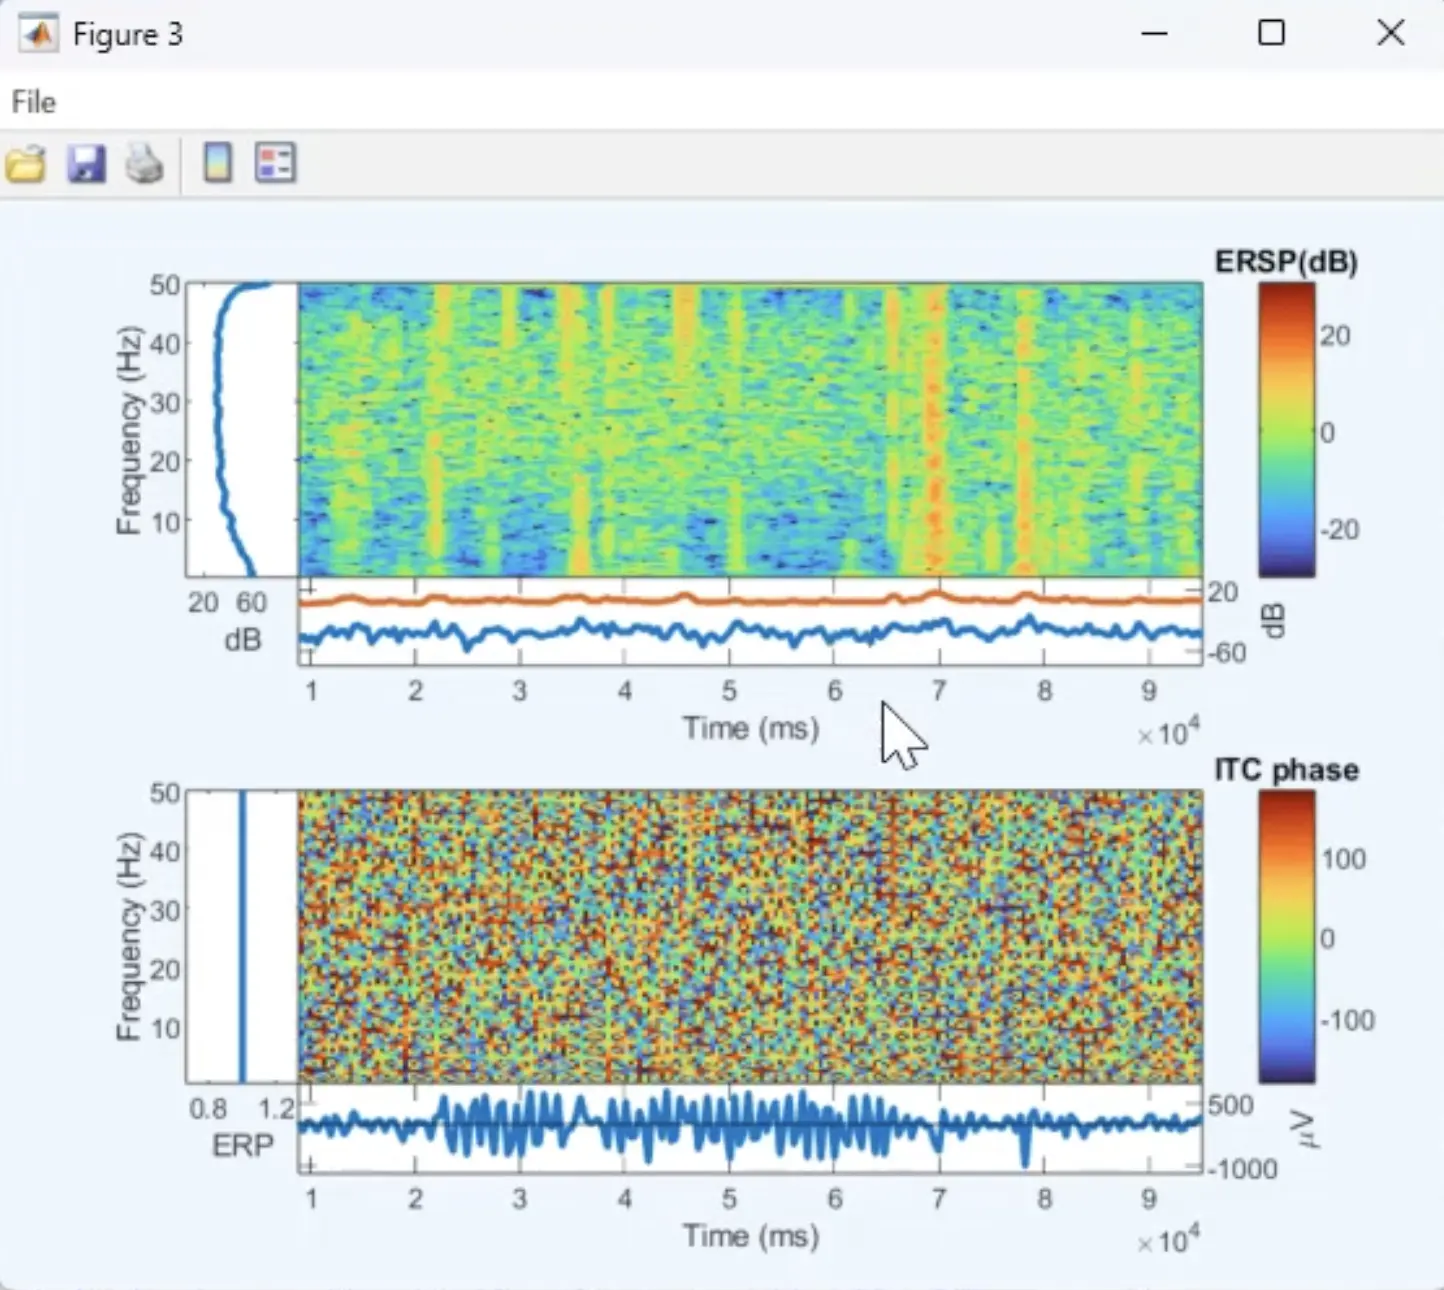
An example of a figure created using EEGLAB Standalone based on the data recorded in this demo.
We hope this was useful and demonstrated how quickly an EEG study can be set up using the Labvanced Desktop app. Thank you!