Perceived Stress Scale (PSS-10)
The PSS-10 is a self-report instrument that measures the degree to which situations in a person's life are appraised as stressful, unpredictable, and uncontrollable over the past month. It was developed by Cohen and Williamson (1988) as a 10-item shortened version of the original 14-item scale (Cohen, Kamarck, & Mermelstein, 1983), and is widely used to assess perceived psychological stress in both research and clinical settings.
Table of Contents
Items and Structure of the PSS-10
The PSS-10 consists of 10 items asking about feelings and thoughts over the past month, such as how often a respondent felt nervous and stressed, felt unable to control important things in their life, or felt confident about handling personal problems. Each item is rated on a 5-point scale: 0 ("Never"), 1 ("Almost Never"), 2 ("Sometimes"), 3 ("Fairly Often"), or 4 ("Very Often"). There are no subscales.
Six items are worded negatively and four positively; the four positively worded items are reverse-scored. The PSS-10 was derived from the original 14-item scale by retaining the 10 items with the strongest factor loadings in a national US probability sample, and was found to have a tighter factor structure and slightly better internal reliability than the 14-item version (Cohen & Williamson, 1988).
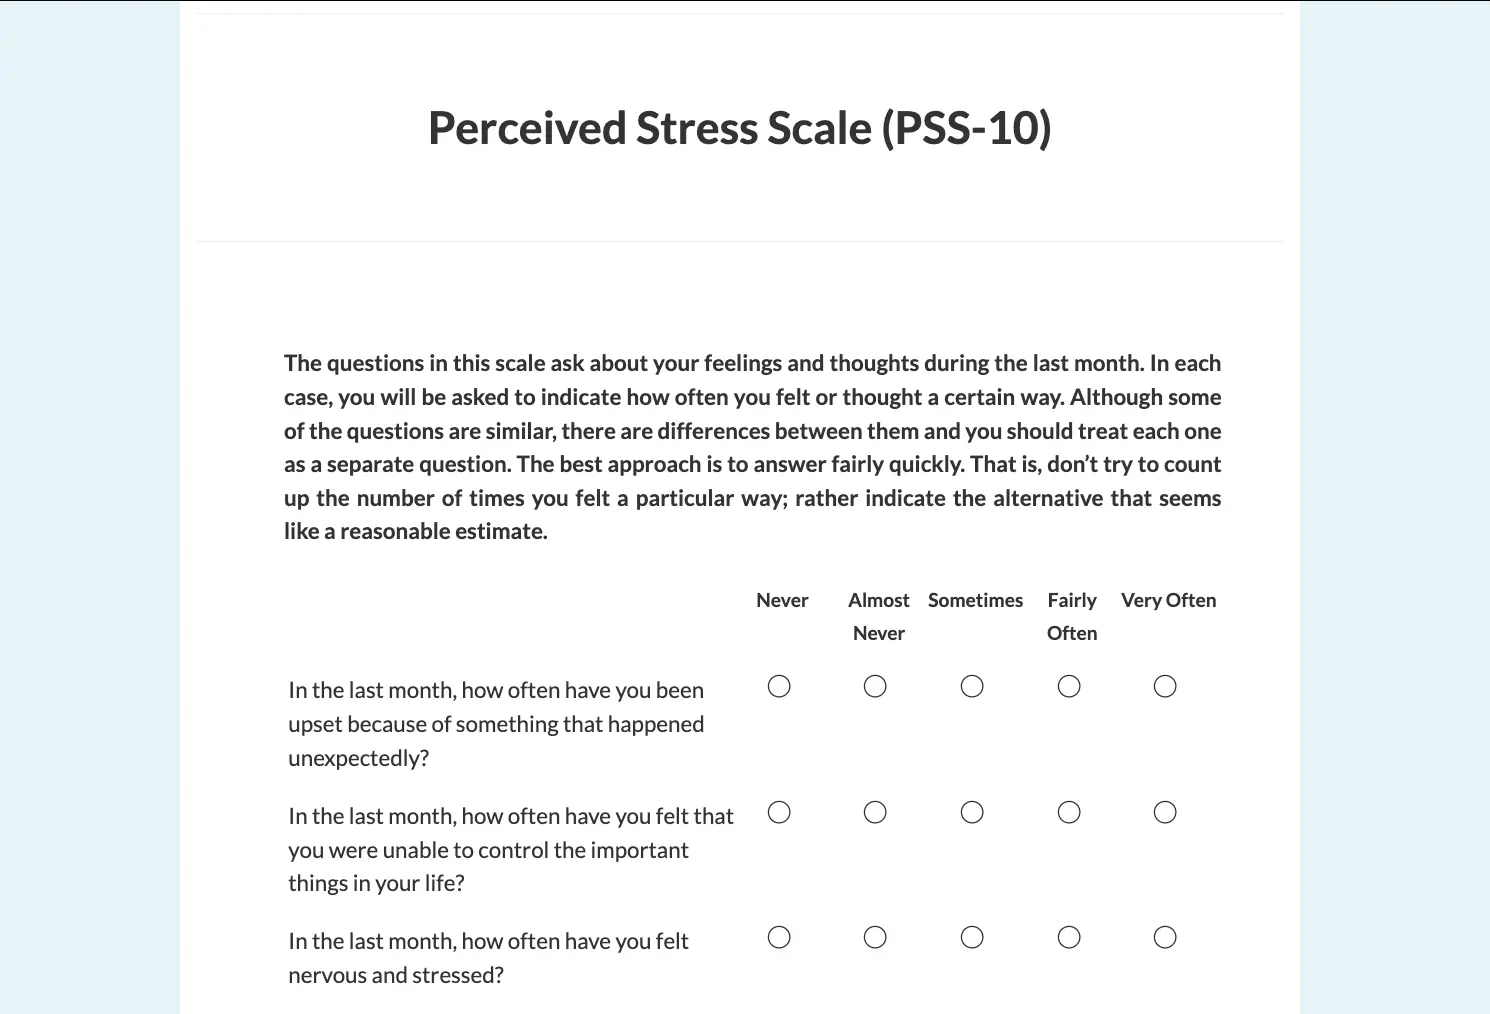
This study measures perceived stress severity using the PSS-10. Responses are automatically scored into a total score within Labvanced.
Click the card above to see the full item list and study structure on Labvanced. Use Inspect to view it directly, or Import to copy the study into your own account and customize it.
Scoring Summary
The 10 item scores, after reverse-scoring the four positively worded items, are summed into a single total score ranging from 0 to 40, with higher scores indicating greater perceived stress. There are no subscales.
For the full scoring procedure and interpretation, see the PSS-10 Scoring and Interpretation guide.
Psychometric Properties of the PSS-10
- Reliability: In a national US probability sample (N = 2,387), the PSS-10 showed good internal consistency (Cronbach's α = .78), slightly higher than the .75 reported for the original 14-item scale in the same sample (Cohen & Williamson, 1988).
- Validity: In the same sample, PSS-10 scores correlated with self-rated health (r = .22), health services utilization (r = .22), and the number of recent life events (r = .32), while showing no meaningful relationship to unrelated variables such as workload demand (r = .06, not significant) (Cohen & Williamson, 1988). The study's authors concluded that "the PSS10 may be at least as good a measure of perceived stress as the longer 14-item version" (Cohen & Williamson, 1988, p. 45).
- Normative Information: In the same national sample, the PSS-10 had a mean score of 13.02 (SD = 6.35). Women scored higher than men (13.7 vs. 12.1), and scores declined slightly with age, from a mean of 14.2 (ages 18-29) to 11.9 (ages 55-64) (Cohen & Williamson, 1988). The PSS-10 does not have an established set of clinical severity cutoff bands; see the Scoring and Interpretation guide for a full normative comparison.
Data Collected with the PSS-10
The PSS-10 captures item-level scores and computed total score within Labvanced. All variables can be viewed and customized within the study's Variables Tab.
| Variable Name | Description |
|---|---|
Item 1 score – Item 10 score | Participant's score (0-4) for each of the 10 individual items, with reverse-scoring for items 4, 5, 7, and 8 already applied |
PSS Items | Array combining all 10 individual item scores |
PSS Score | Sum of all 10 item scores, the total PSS-10 score (range 0-40) |


Technologies Supporting the PSS-10
The PSS-10 is a self-report instrument, but Labvanced allows additional data streams to be layered onto the study for deeper analysis beyond the item responses themselves.
- Automatic Scoring, No-Code Setup: The PSS-10's reverse-scoring and summation are handled automatically within Labvanced's Questionnaire page structure, with no manual calculation required.
- Response Behavior via Mouse Tracking: Cursor movement toward and away from response options can reveal hesitation or indecision while a participant is completing a stress item, adding a behavioral layer beyond the selected answer itself.
- Webcam-Based Eye Tracking: Gaze patterns while reading and answering each item can be captured with built-in, code-free webcam eye tracking, useful for attention-check analysis or studying how participants engage with negatively vs. positively worded items.
- Audio and Video Recording: Sessions can be recorded alongside item responses, useful when a researcher wants a qualitative record of participant behavior during a stress assessment.
- Desktop App for Controlled Administration: For clinical or lab settings administering the PSS-10 as part of a larger intake battery, the Labvanced desktop app supports standardized, offline-capable administration on dedicated in-lab machines.
Mouse Tracking
Capture cursor movement and response hesitation alongside standard questionnaire answers.

Webcam Eye Tracking
Capture gaze patterns and visual attention with built-in, code-free and peer-reviewed webcam eye-tracking.

Desktop App
Run in-lab, controlled administration using the Desktop App, ideal for clinical intake settings.
Administration Options for the PSS-10
There are several ways this instrument can be configured in Labvanced.
- Standard Questionnaire Setup: The PSS-10 is built using a standard
Page Frame, where items are listed top to bottom. See the Questionnaires implementation guide for how Page Frames, question objects, and scoring are set up in Labvanced. - Repeated Administration: The PSS-10 is frequently administered at multiple timepoints to track perceived stress over the course of an intervention or longitudinal study. Labvanced supports repeated, scheduled administration with automated participant reminders.
- Multi-Language Deployment: The PSS-10 has been independently translated and validated in numerous languages. Labvanced supports multi-lingual study deployment, allowing a translated version to be configured for the target population.
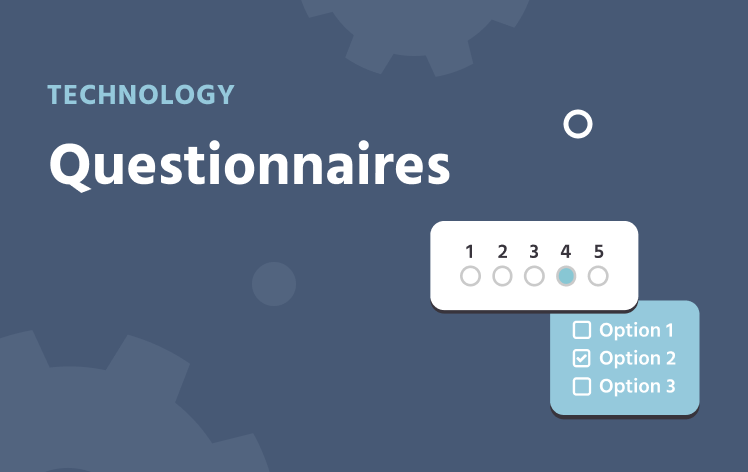
The card below covers the different ways researchers can build and analyze questionnaires in Labvanced. Beyond fixed Likert items, it supports image, video, and audio stimuli, drag-and-drop and slider-based interactions, branching logic and randomization, and real-time feedback. Layouts can be freely positioned on a canvas or auto-flowing in a page frame, and responses can be automatically scored, reverse-scored, and timed down to the individual item.
If there is something else you'd like to know, please feel welcome to write to us and ask:
Recommended Use and Applications of the PSS-10
The PSS-10 is used across clinical, occupational, and general population research to screen for and quantify perceived psychological stress.
- General population stress assessment: Used in large-scale population surveys to establish normative stress levels and examine differences across demographic groups such as age, sex, and income (Cohen & Williamson, 1988). In a community-based sample of 480 adults in an urban resettlement colony in Delhi, India, the PSS-10 revealed a high burden of perceived stress, with peak levels in the 35-50 age group and an independent association with lower socioeconomic status (Pangtey et al., 2020).
- Health and health-behavior research: Used to examine associations between perceived stress and self-rated health, health service utilization, and health behaviors such as sleep, smoking, and alcohol use (Cohen & Williamson, 1988).
- Occupational stress research: Used to examine how job characteristics such as workload and responsibility relate to perceived stress (Cohen & Williamson, 1988). Also used directly in occupational health screening: in a cohort of 682 Australian stone benchtop workers undergoing screening for silica-related lung disease, the PSS-10 showed good internal consistency (Cronbach's α = .88), though validity was weaker among workers who used an interpreter or spoke a language other than English at home, underscoring the importance of population-appropriate translated instruments in linguistically diverse workforces (Hore-Lacy et al., 2024).
- Treatment-outcome and longitudinal monitoring: Administered repeatedly to track perceived stress over the course of a psychological or behavioral intervention. Across two longitudinal cohorts followed for up to 39 months with as many as 13 repeated administrations, roughly half of the total variance in PSS scores reflected stable between-person differences rather than within-person change over time, a finding relevant to interpreting score change across repeated administrations (Harris et al., 2023).
Commonly Paired With the PSS-10
Wisconsin Card Sorting Task (WCST)
Measures cognitive flexibility through perseverative errors on a rule-switching task. Using the PSS-10 specifically, Knauft et al. (2021) found that individuals reporting high chronic perceived stress showed a different pattern of perseveration under acute stress than those with lower chronic stress, a direct behavioral link to what this instrument measures.
Stroop Task
Measures attentional control and inhibition through color-word interference. Khodami et al. (2026) found that participants with high perceived stress had significantly lower Stroop accuracy than those with low stress (p < .001) across all three experiments. The high-stress group also underperformed the moderate-stress group, a gap that strengthened from p < .01 at baseline to p < .001 once task-irrelevant auditory or visual distraction was introduced, a direct behavioral link to what this instrument measures.
References
- Cohen, S., Kamarck, T., & Mermelstein, R. (1983). A global measure of perceived stress. Journal of Health and Social Behavior, 24(4), 385-396.
- Cohen, S., & Williamson, G. (1988). Perceived stress in a probability sample of the United States. In S. Spacapan & S. Oskamp (Eds.), The Social Psychology of Health (pp. 31-67). Newbury Park, CA: Sage.
- Harris, K. M., Gaffey, A. E., Schwartz, J. E., Krantz, D. S., & Burg, M. M. (2023). The perceived stress scale as a measure of stress: Decomposing score variance in longitudinal behavioral medicine studies. Annals of Behavioral Medicine, 57(10), 846-854. https://doi.org/10.1093/abm/kaad015
- Hore-Lacy, F., Gwini, S., Glass, D. C., Dimitriadis, C., Jimenez-Martin, J., Hoy, R. F., Sim, M. R., Walker-Bone, K., & Fisher, J. (2024). Psychometric properties of the Perceived Stress Scale (PSS-10) in silica-exposed workers from diverse cultural and linguistic backgrounds. BMC Psychiatry, 24, 181. https://doi.org/10.1186/s12888-024-05613-6
- Khodami, M. A., Contemori, G., Battaglini, L., & Jansarvatan, M. (2026). Stress effects on cognition: Evidence for stress-related disruption of attention and inhibitory control. Heliyon, 12, e44660. https://doi.org/10.1016/j.heliyon.2026.e44660
- Knauft, K., Waldron, A., Mathur, M., & Kalia, V. (2021). Perceived chronic stress influences the effect of acute stress on cognitive flexibility. Scientific Reports, 11, 23629. https://doi.org/10.1038/s41598-021-03101-5
- Pangtey, R., Basu, S., Meena, G. S., & Banerjee, B. (2020). Perceived stress and its epidemiological and behavioral correlates in an urban area of Delhi, India: A community-based cross-sectional study. Indian Journal of Psychological Medicine, 42(1), 80-86.