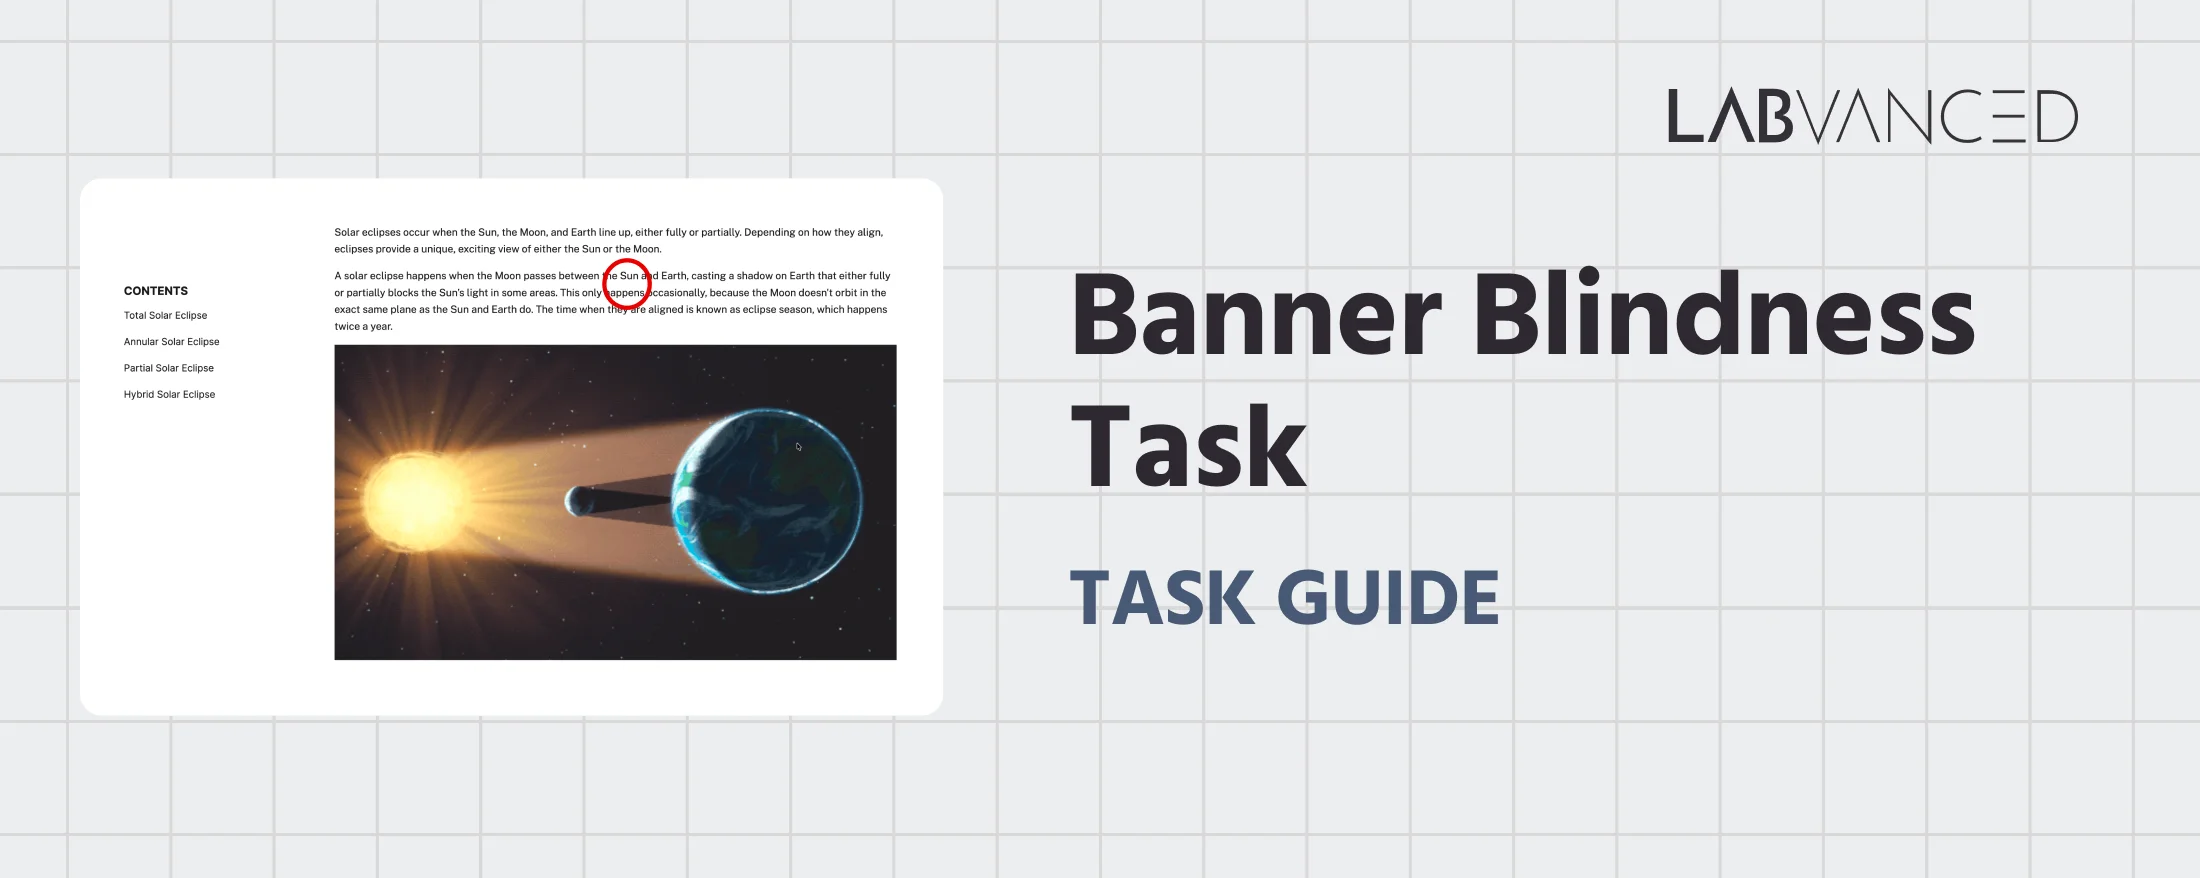
Banner Blindness Task
The Banner Blindness Task measures how people read a web page and whether they skip over its promotional, banner-like content. Participants read a live web page for three minutes while webcam eye tracking records where they look. Fixations and dwell time are collected for the page title, the images, every section of the text, and the page's promotions. At the end, each participant sees a personal reading profile. The term "banner blindness" goes back to Benway (1998), who found that web users often missed a site's own prominent, banner-style content.
Table of Contents
Task Format | Banner Blindness Task
The study has three parts and takes about nine minutes:
- Instructions: two screens explain the task and the rules: read normally, don't click anything on the page, and close any pop-up or feedback box with its X.
- Reading: after a webcam eye tracking calibration, NASA's public-domain page "Types of Solar Eclipses" appears inside a
Website Frame. Participants scroll and read as they normally would. After three minutes, the study moves on by itself. - Results: two screens show the participant's own reading profile, built from their eye tracking data.
The page is divided into 17 areas of interest (AOIs) in four groups:
- Title: the page title.
- Images: the three images in the article.
- Text: eight AOIs covering the article's sections and their headings, grouped into five parts from the start of the article to the end.
- Promotions: the "Learn More" button and the four "Discover More Topics From NASA" cards at the end of the page.
Each AOI is anchored to an element of the page itself, so it moves with the content as the participant scrolls.
The results screens compare how much attention each part of the page got with how much space it takes up. A bar at 1.0× means an area got exactly the attention its size would predict. This comparison matters because large areas collect more looks just by being large.
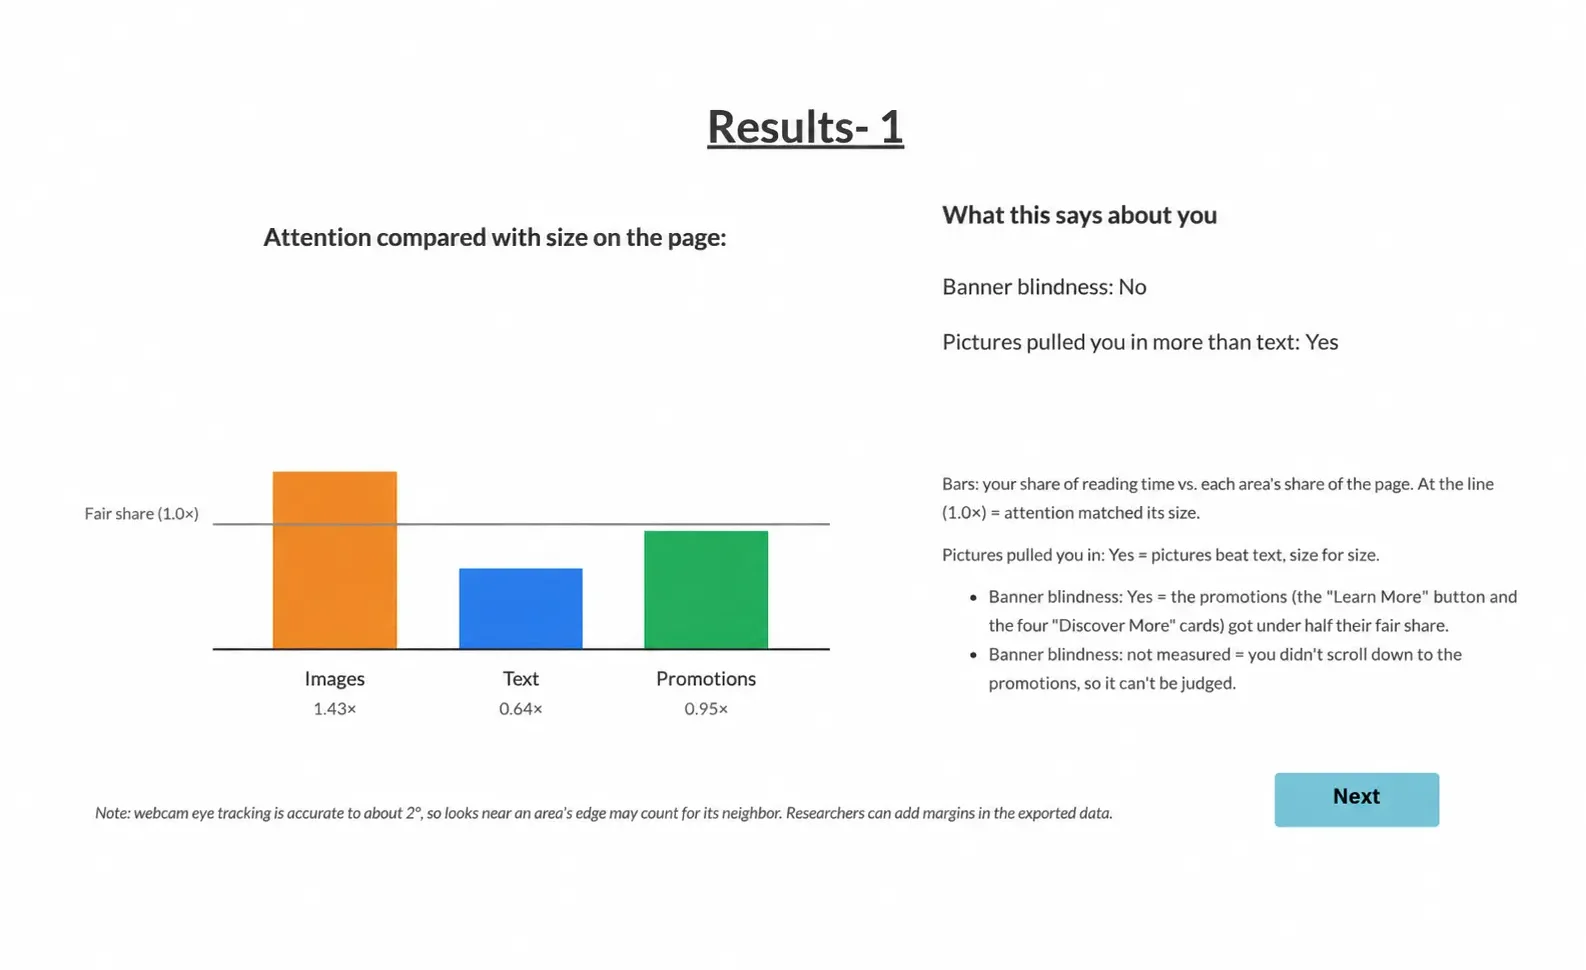
The first screen shows images, text, and promotions side by side, plus two results:
- Banner blindness: "Yes" when the promotions got less than half the attention their size would predict, "No" otherwise. Participants who never scrolled down to the promotions see "not measured" instead, because they had no chance to look at them.
- Pictures pulled you in more than text: "Yes" when the images got a bigger share of attention than the text, size for size.
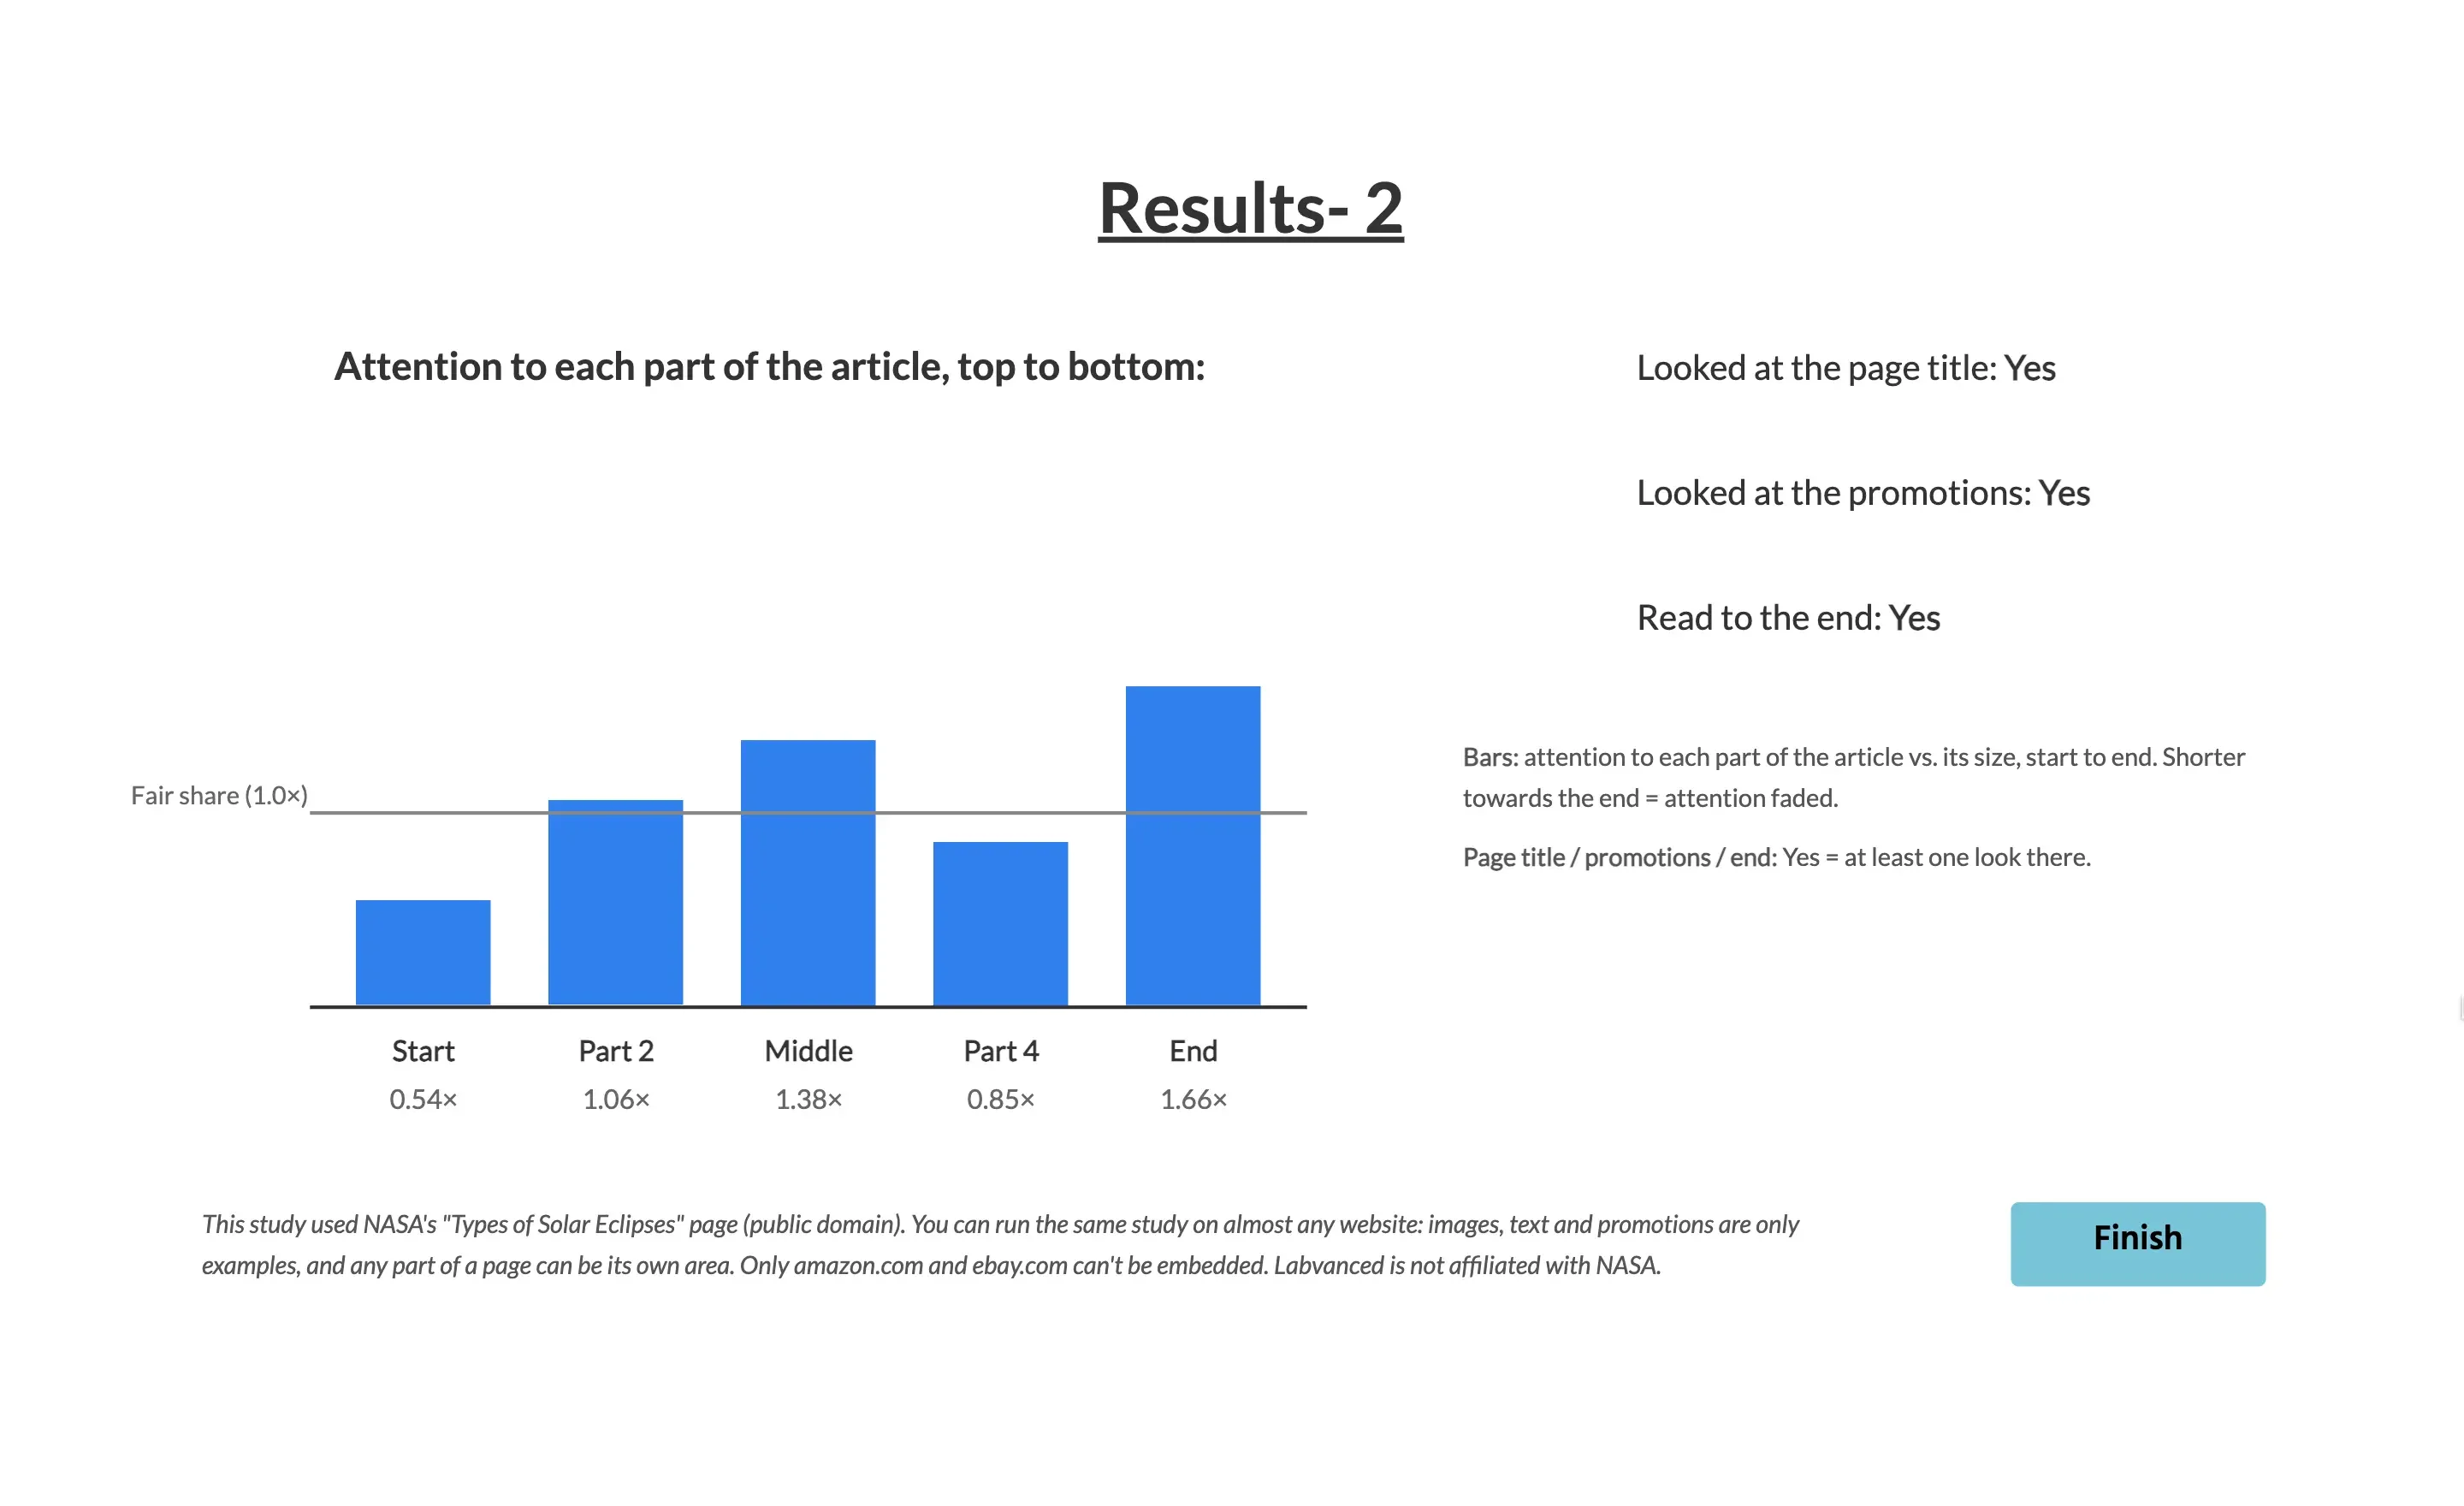
The second screen shows how attention changed across the five text parts, from the start of the article to the end, plus three checks: whether the participant looked at the page title, looked at the promotions, and read to the end. A note on this screen names the page used and reminds researchers that the same study can run on almost any website.
Desktop Version
The task runs in Google Chrome on a laptop or desktop computer. Embedding a live web page requires the free Labvanced Web Bridge extension, which every participant installs before starting. Participants who don't have it yet are shown an install prompt before the study begins.
Mobile Version
The task is not available on phones or tablets, because Chrome extensions don't run on mobile browsers.
Data Collected with the Banner Blindness Task
The Banner Blindness Task records every fixation on every AOI, every click, and any navigation away from the page. Running totals of dwell time per page area are calculated while the participant reads, which is what makes the personal results screens possible. All variables can be viewed and customized within the task's Variables Tab.
Below are the key variables collected in the Labvanced version of the Banner Blindness Task:
| Variable Name | Description |
|---|---|
fixation_data | One row per fixation: X and Y position on the page, duration (ms), start time, end time, and dispersion |
fixation_AOI | The AOI each fixation landed on (for example AOI_Image2 or AOI_Promo3), one row per fixation in the same order as fixation_data |
dwell_Headline, dwell_Images, dwell_Promos | Total fixation duration (ms) on the page title, the images, and the promotions during the reading time |
dwell_T1 to dwell_T5 | Total fixation duration (ms) on each of the five text sections, from the start of the article to the end |
ratio_Images, ratio_Text, ratio_Promos | Attention ratio for each area: its share of reading time divided by its share of page area. 1.0 means attention matched the area's size |
ratio_T1 to ratio_T5 | Attention ratio for each text section, compared within the text only |
reached_end | 1 if the participant looked at the last text section at least once; used to decide whether banner blindness can be judged |
click_data | One row per click: the AOI name and label (empty when the click was outside every AOI), and the X and Y position |
url_log | The address of any page the participant navigated to, so time spent away from the page can be excluded |
From fixation_data and fixation_AOI, the standard AOI measures can be calculated for any single AOI: fixation count, total dwell time, mean fixation duration, and time to first fixation.
Clicks are a finding in their own right. Participants are asked not to click, so a click on a promotion card or the "Learn More" button shows the promotion did more than catch the eye. click_data records which AOI was clicked, and url_log records where the participant went and when they returned.
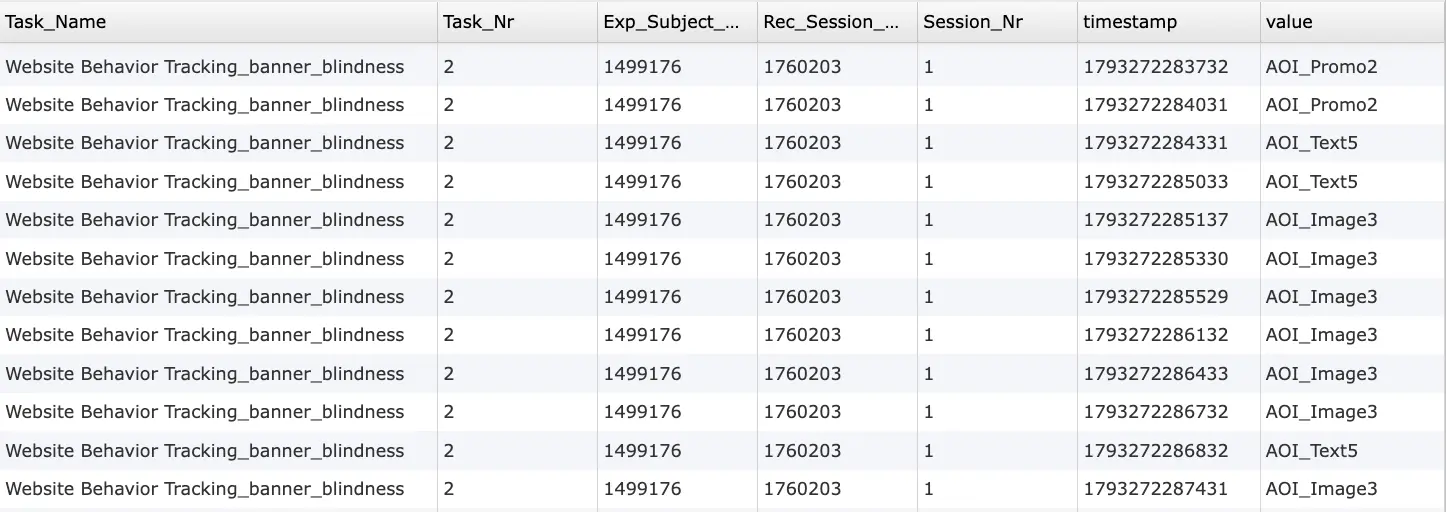
fixation_AOI variable collected with the Banner Blindness Task in Labvanced. Each row is one fixation, with its timestamp and the AOI it landed on, here moving from the second promotion card to the last text section and the third image. 
This study measures how people read a web page and whether they skip its promotions. Participants read a NASA web page for three minutes while webcam eye tracking records fixations and dwell time on the title, images, text, and promotion cards.
Technology for the Banner Blindness Task
Labvanced includes several technologies that make the Banner Blindness Task possible online:
Website Frame and Web Bridge: A
Website Frameshows a live web page inside the study, and the Web Bridge extension makes embedding possible on pages that normally block it. Learn more on the Website Eye Tracking technology page.Element-Anchored AOIs: Each AOI is attached to an element of the page through a CSS selector, so it follows the content as the participant scrolls. See Selecting and Adjusting Website AOIs.
Webcam Eye Tracking 2.0: Gaze is recorded with the participant's own webcam, with no extra hardware. For areas of interest such as regions of a page, the Eye Tracking 2.0 validation found 1.8 to 1.9° of visual angle on the High tier (Labvanced, 2026). The first generation of the system was validated against an EyeLink 1000 in a peer-reviewed comparison (Kaduk et al., 2024).
Built-in Fixation Detection: Fixations are detected automatically while the participant reads, and each one is matched to the AOI it landed on.
Live Calculations in the Event System: Dwell time per area is added up during reading, and the attention ratios are calculated with
Set / Record Variableactions before the results screens appear, with no post-processing needed.Privacy by Design: All face and eye processing runs on the participant's device. Only numeric gaze data is saved, never webcam images or video.

Webcam Eye Tracking
Capture gaze patterns and visual attention with built-in, code-free and peer-reviewed webcam eye-tracking.
Timing Precision
Capture reaction times, task performance, and more with millisecond accuracy for time-sensitive tasks.
Website Eye Tracking
See where people look, click, and scroll on a live website embedded in your study with Web Bridge.
Customization of the Banner Blindness Task
There are many ways to go about customizing this template. Below are a few themes researchers commonly ask about when it comes to modifying this task.
Web Page and AOIs
Point the Website Frame at a different page, such as a product page, a landing page, or your own prototype, then anchor new AOIs to its elements with Pick Element. Almost any website works; only amazon.com and ebay.com can't be embedded. Images, text, and promotions are only examples: any part of a page can be its own AOI group. Keep the AOI names consistent if you want to reuse the existing events. Each AOI shows green in the editor when its selector matches the page and red when it doesn't, which makes it easy to check before running the study.
AOI Spacing and Gaze Accuracy
With this template's settings, webcam eye tracking is accurate to about 2°, so a look near the edge of one AOI can be counted for its neighbor. AOIs that fully cover each element catch nearly every real look (high sensitivity) but also some looks at neighbors. A gap between neighboring AOIs reduces those misattributed looks (high specificity) but misses some real ones. Which matters more depends on your study design.
In this template, the first image's AOI starts slightly below the image, leaving a gap of about 87 px to the paragraph above, set with the Size offset and Position shift fields. Since fixation_data stores every fixation's position, other margins can also be applied in the analysis.
Reading Time and Instructions
The reading frame ends after 180,000 ms (three minutes), set in the frame's Duration: field. Shorten or lengthen it to fit your page, and adapt the instruction screens to your task, for example a search task ("find the price") instead of free reading.
Page Areas and Results Screens
The attention ratios depend on how much page area each group of AOIs covers. If you change the page or the AOIs, update the area weights accordingly. The results screens can be removed for studies where participants shouldn't see their data, or extended with new bars and Yes/No results.
Eye Tracking Settings
The template uses the High Accuracy - Moderate Effort tier with screening limited to failed calibrations, so few participants are turned away. For smaller AOIs, a longer calibration and stricter screening improve accuracy, at the cost of screening out more participants (Labvanced, 2026).
If there is something else you'd like to know, please feel welcome to write to us and ask:
Recommended Use of the Banner Blindness Task
The Banner Blindness Task is suited to research on how people read and attend to web pages, from advertising to news media and web design:
Advertising Research: Measure how much of a reader's attention reaches the ads around an article, using webcam eye tracking outside the lab. In an experiment with 1,013 participants in the UK and US, who read news articles paired with brand ads on their own desktop or smartphone webcams, more attention to an article spilled over to the ads on the same page. One additional second of attention to an ad raised the probability of recalling the brand by 3.4 percentage points (Simonov et al., 2025).
UX and Web Design: Test how the reader's task changes what gets seen. When 100 participants read a news article and then looked for where to click next, they largely disregarded the banner ads while reading, and banners embedded in the main content drew more attention while browsing (Simonetti & Bigné, 2024).
Banner Ad Design: Compare ad formats on the same page. In a study of 67 participants browsing 16 web pages, text-type banner ads had a lower blindness rate and were attended to and remembered better than picture-type banner ads (Ning et al., 2023).
Reading Patterns on the Web: Check whether attention drops off further down a page. A 2017 eye tracking study found that the F-shaped scanning pattern still appears on desktop and mobile, mainly on pages with little formatting, and that clear headings and formatting reduce it (Pernice, 2017).
Navigation and Content Promotion: Measure whether readers notice the links and teaser cards that point to more content, and whether they click them, which is recorded alongside gaze.
References
Benway, J. P. (1998). Banner blindness: The irony of attention grabbing on the World Wide Web. Proceedings of the Human Factors and Ergonomics Society Annual Meeting, 42(5), 463–467. https://doi.org/10.1177/154193129804200504
Kaduk, T., Goeke, C., Finger, H., & König, P. (2024). Webcam eye tracking close to laboratory standards: Comparing a new webcam-based system and the EyeLink 1000. Behavior Research Methods, 56(5), 5002–5022. https://doi.org/10.3758/s13428-023-02237-8
Labvanced. (2026). Labvanced Eye Tracking 2.0: Accurate webcam eye tracking for all online research. Labvanced Lab Notes. https://www.labvanced.com/content/research/en/lab-notes/2026-10-webcam-eyetracking-2-0/
Ning, B., Luo, S., Wang, A., & Zhang, M. (2023). Effects of banner ad type, web content type and theme consistency on banner blindness: An eye movement study. Cognitive Processing, 24(3), 313–326. https://doi.org/10.1007/s10339-023-01131-7
Pernice, K. (2017). F-shaped pattern of reading on the web: Misunderstood, but still relevant (even on mobile). Nielsen Norman Group. https://www.nngroup.com/articles/f-shaped-pattern-reading-web-content/
Simonetti, A., & Bigné, E. (2024). Does banner advertising still capture attention? An eye-tracking study. Spanish Journal of Marketing - ESIC, 28(1), 3–20. https://doi.org/10.1108/SJME-11-2022-0236
Simonov, A., Valletti, T., & Veiga, A. (2025). Attention spillovers from news to ads: Evidence from an eye-tracking experiment. Journal of Marketing Research, 62(2), 294–315. https://doi.org/10.1177/00222437241256900
Related Tasks
Banner blindness research sits alongside other eye tracking and reading tasks in Labvanced's task library.
Self-Paced Reading Task
Participants read ten sentences at their own pace while webcam eye tracking records dwell time, fixations, and time to first fixation on every word.
Face Perception Task
Participants view happy, neutral, and sad faces while webcam eye tracking records dwell time and fixations on the eyes and mouth, then identify the emotion each face showed.
Preferential Looking Paradigm
Participants view side-by-side of either images or videos, while gaze patterns, fixation durations and head orientation are recorded, as well as a video recording of the participant.